
In this part you can display your data in different diagrams and tables. To access the analysis, click on an Analysis-Sheet in the toolbar.
In the following overview, you can see an example of an analysis of a P2P-process. This gives you a first overview of your data.
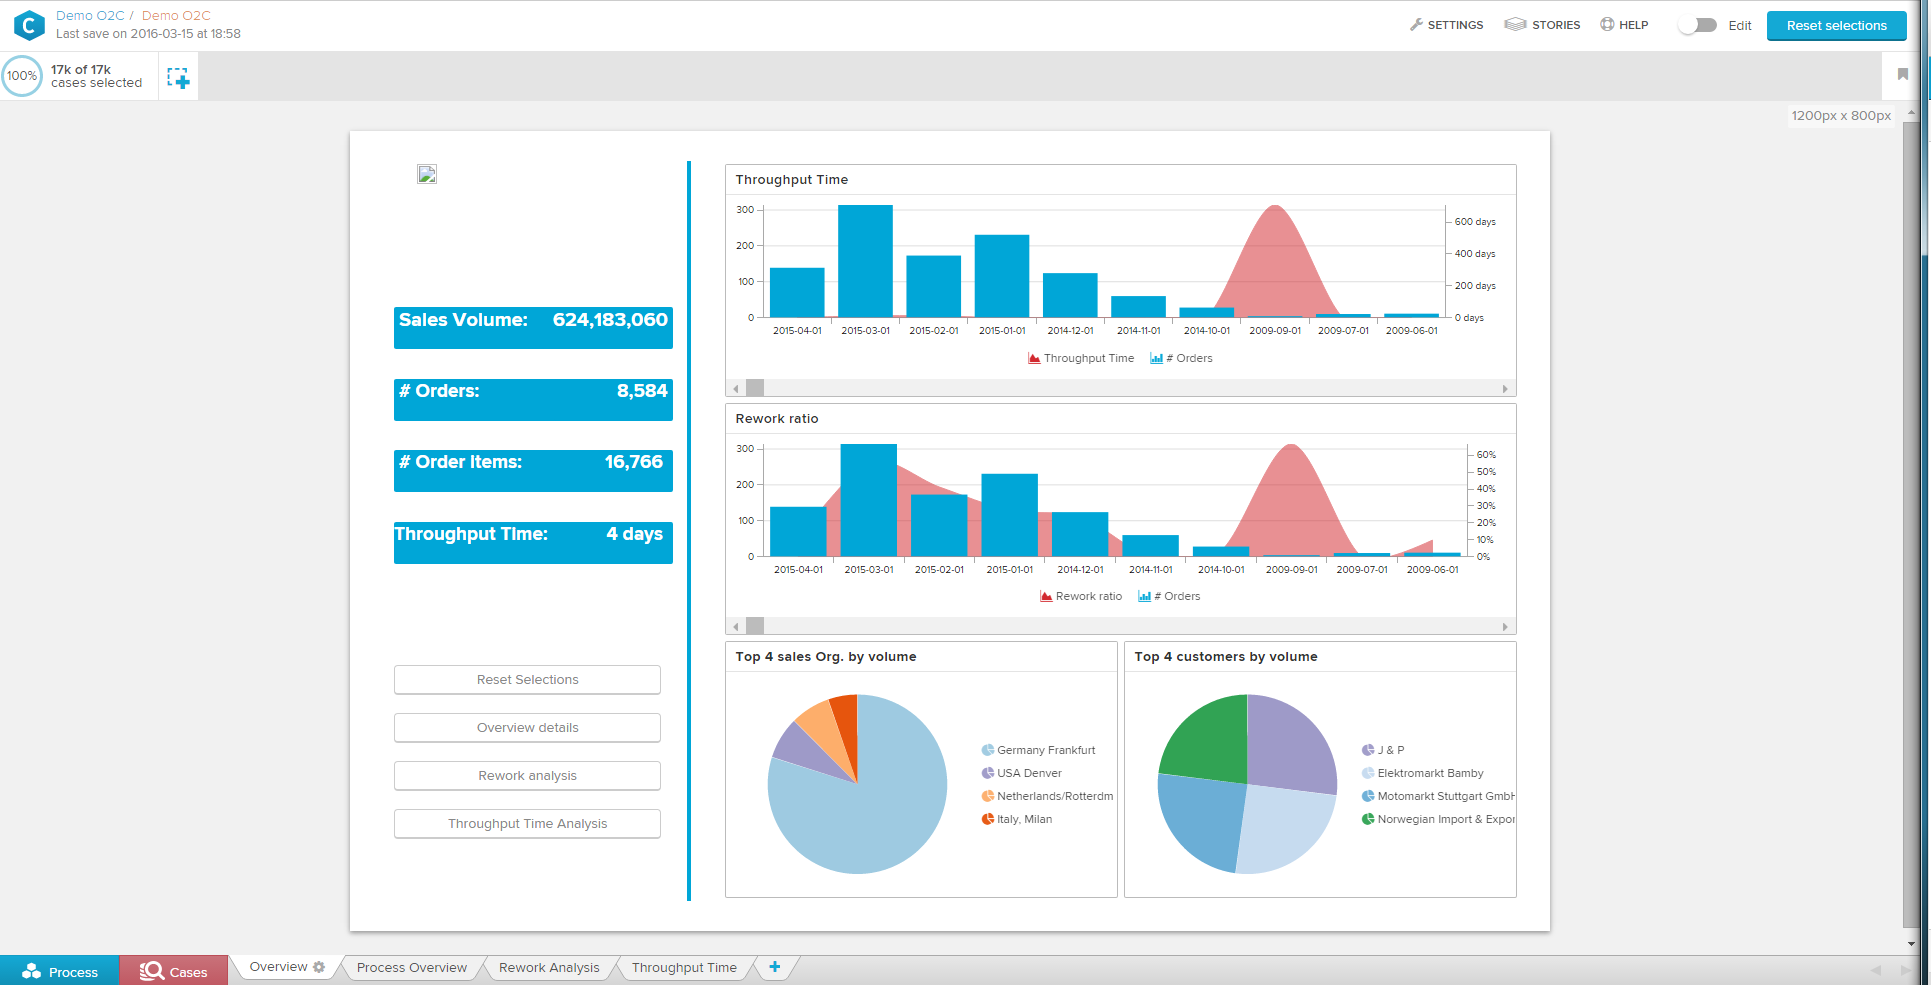
- Toolbar: Here you can navigate back to the Management UI and your folder structure over the breadcrumps in the top left. With the buttons on the top right you can switch to the Stories UI or to the Edit Mode.
- Selection Overview: The selection overview includes all active selections. Per default, no selection is activated and thus all cases are included in the analysis. In this section, all predefined selections as well as all selections created from components will be shown.

The case coverage changes as soon as you activate a filter. Here you can get more information about dynamic filters.
Tip
The toolbar and the selection overview will be visible on all 3 document parts. If you activate any selection on one of the three document parts, the data on all three document parts will be altered towards your selection, if you didn't deactivate this option in the settings of a specific component.
- Analysis Canvas: This is the main part of your analysis sheet. Every component that is added will be displayed here.
- Analysis Navigation: In your analysis, it is possible to create multiple sheets to sort your analysis for specific subjects or time periods. You can navigate these sheets in the bottom tab of the analysis.