The overview section was designed to provide the most important information about your process conformance at a first glance!
All cases, that are selected through any active Selections will be compared to your Process Model.
Overview
The Overview section includes 4 KPIs and a chart, that displays the relative amount of conformance over a past period of time.
| Expand | ||
|---|---|---|
| ||
This KPI is based on the amount of cases, that match your Process Model. This value is furthermore the basis for the Conformance history chart. |
| Expand | ||
|---|---|---|
| ||
This KPI returnes the above mentioned Conformance KPI in absolute numbers. |
| Expand | ||
|---|---|---|
| ||
Violations are derivations from your process model. This KPI displays the number of Abweichungen an x verschiedenen Stellen |
| Expand | ||
|---|---|---|
| ||
Whitelist Violations are violations, that are regarded in the Whitelist section. They won't appear in your (direct) violations. |
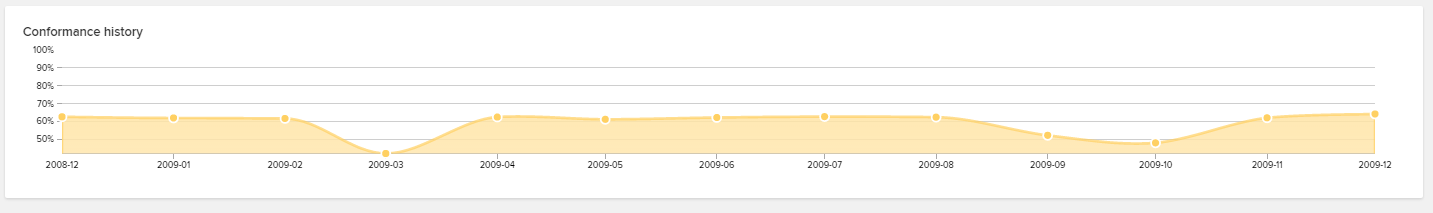
Conformance history
The conformance history is a chart that displays the course of the relative conformance.
Effects on KPIs
All KPIs in this section are comparisons of cases, that conform to your Process Model with those, that do not conform.
Conforming cases are colored green, non-conforming cases are colored red.
For each KPI, a "Violations increased..." statement is added. This helps you to identify the effect of cases, that violate your process model.
By default, there are two KPIs visible:
| Expand | ||
|---|---|---|
| ||
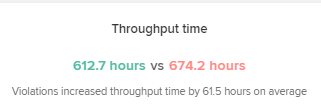
This KPI compares the throughput time:
|
| Expand | ||
|---|---|---|
| ||
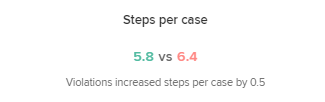
This KPI compares the events per case:
|
You can add custom KPIs in the PI Conformance tool, too!