| Info | ||
|---|---|---|
| ||
The following options are only available for charts, that offer linear axis: |
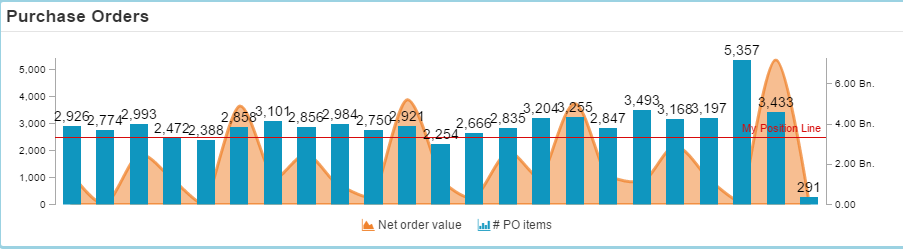
The Position line is a useful opportunity to offer a comparison to a certain KPI at first glance.
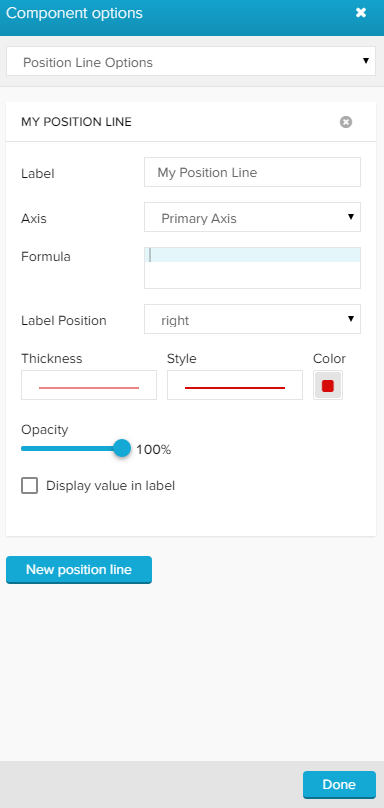
The following options are available:
| Expand | ||
|---|---|---|
| ||
You can (optionally) label your position line.
The name will show up above your position line. You can specify the exact position with Label Position.
|

| Expand | |||||
|---|---|---|---|---|---|
| |||||
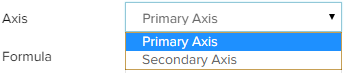
If you activated a secondary axis for this chart, you can choose the reference for the position line function in this field. Choose between primary axis and secondary axis.
|
| Expand | ||
|---|---|---|
| ||
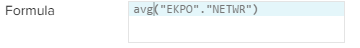
The position line is a function, that is based on the selected axis. You can either enter a fixed value (e.g. 3000), or insert a PQL statement. Changes to the Formula will be applied immediately.
|
| Expand | ||
|---|---|---|
| ||
If you have set a label, you can specify its position on the position line with the Label Position. You can choose between left, center and right with the dropdown menu.
|

| Expand | ||
|---|---|---|
| ||
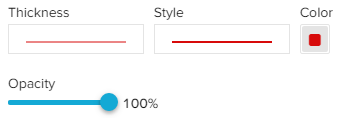
You may adjust the thickness, style and color of your position line, as well as its opacity.
|
| Expand | ||
|---|---|---|
| ||
With this checkbox, you can extend the title in the chart by the estimated value of your formula.
|
| Info | ||
|---|---|---|
| ||
You can add an unlimited amount of position lines to your graph. To add another position line, use the |