The Process Explorer is the core element of SAP Process MIning by Celonis 4.2, a powerful instrument making it possible to visualize and analyze processes.
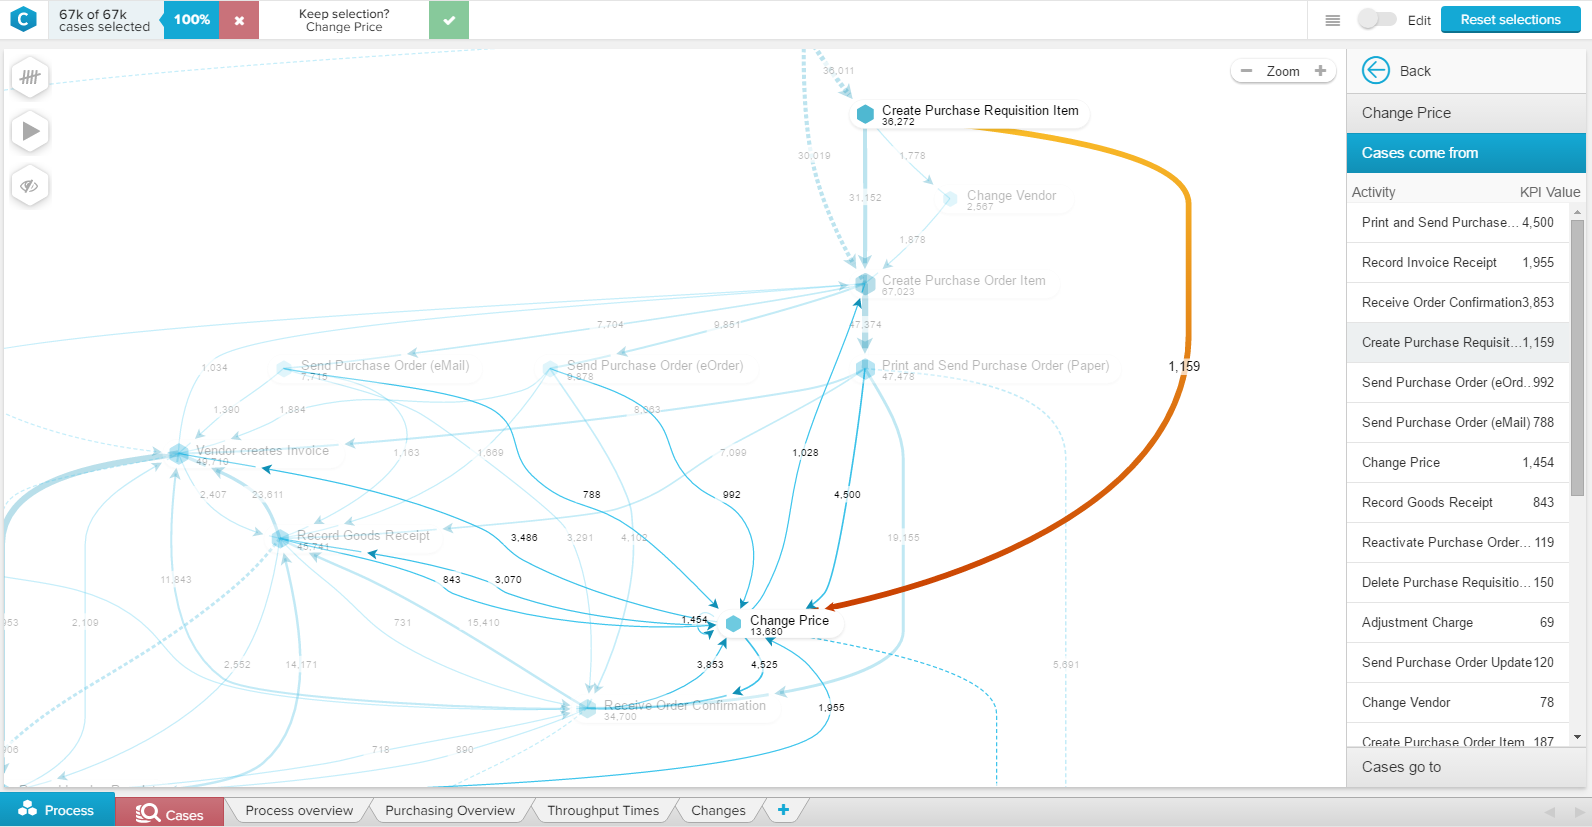
In the following figure, you can see an exemplary display of the process explorer, showing all its different features which will be explained throughout the following sections.
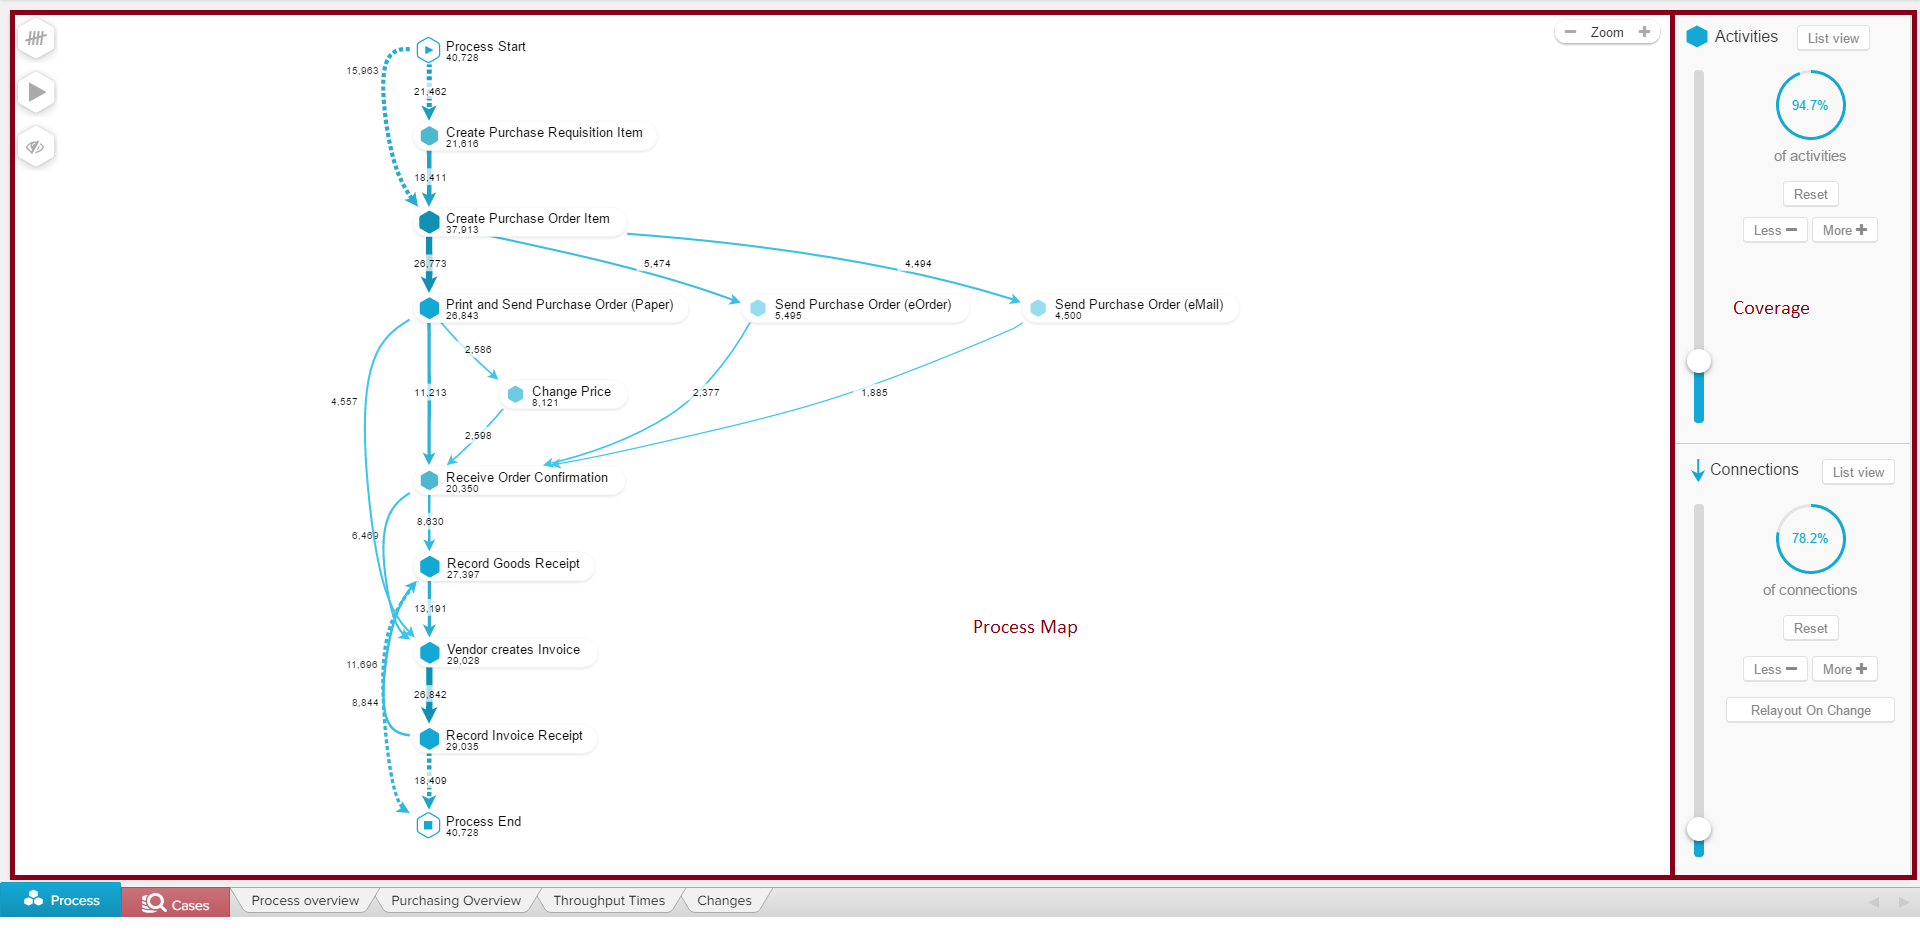
The Process Explorer was designed to show processes in the most intuitive and flexible manner: As a process model!
Different activities will be displayed as nodes, transitions between activities as edges.
Nodes & Edges
Every node and edge will show the total number of cases passing through it, based on the current Selection.
This number is visually supported by the thinkess and the color intensity of all nodges and edges.
The more cases pass through this activity or tranisions, the thicker and darker its color will be.
Selections within the Process Explorer
You can apply a new Selection within the Process Explorer!
Choose any edge or nodge you wish to filter for, and right-click on it.
The following options are available:
Nodge (Activities)
| Tip | ||
|---|---|---|
| ||
Use your mouse to move across the process map. You can furthermore use your mousewheel to zoom. Additionally, these buttons might help you:
Use the - / + buttons to zoom out / in. If you hover "Zoom", "Reset" will appear. Click on "Reset" to get back to the initial view. |

Details
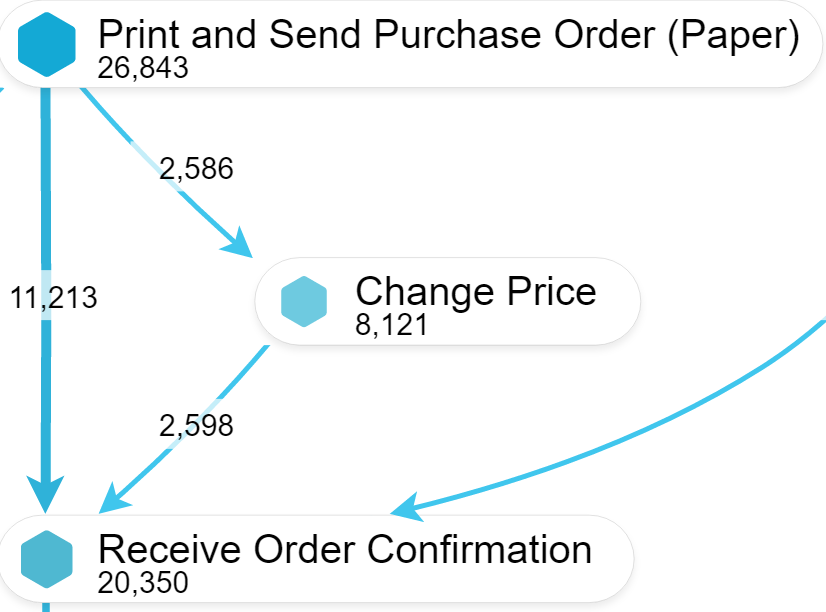
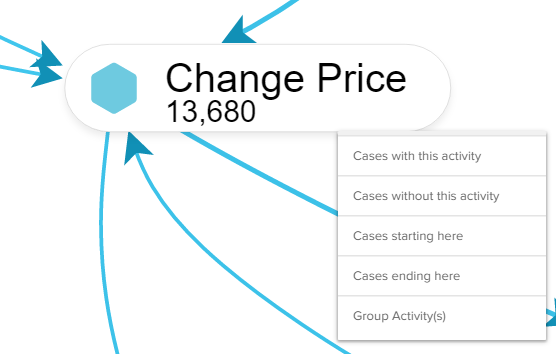
If you select (left-click) any activity or any connection in your process map, the former Coverage Bar will now show details of your selection.
To explain these details, we will focus on the "Change Price" activity with its (incoming and outgoing) connections.
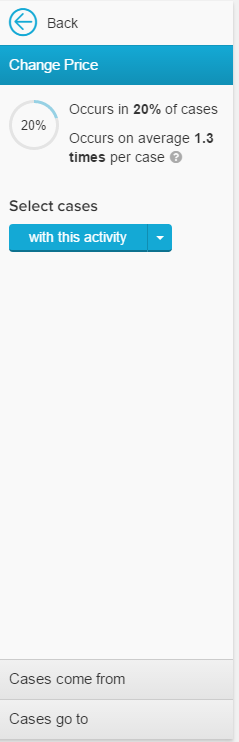
Activity Details
In the upper part, you will see quantitive measures about the occurance of the selected activity.
| Info | ||
|---|---|---|
| ||
These measures are based on the current Selection. |
| Expand | ||
|---|---|---|
| ||
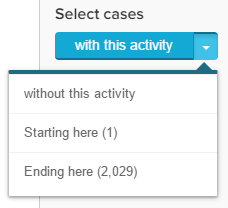
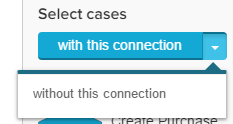
You can apply new Selections to get a deeper understanding of this activity using The white arrow on the right side will open a drop-down menu, offering the same selection possibilities as already explained above.
|
| Expand | ||
|---|---|---|
| ||
The
Hover any activity from the list to see the connection highlighted in your process graph:
You can directly apply a Selection with this connection |
Edges (Transitions)
| Expand | ||
|---|---|---|
| ||
| Expand | ||
| ||
| Expand | ||
| ||
| Expand | ||
| ||
Selects all cases who end with this activity.
|
| Expand | |||||||||||||||
|---|---|---|---|---|---|---|---|---|---|---|---|---|---|---|---|
| |||||||||||||||
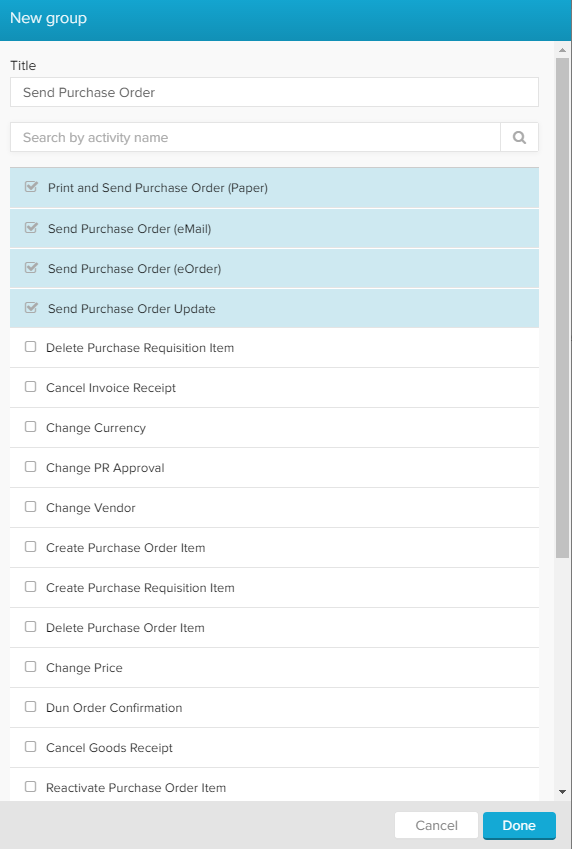
You can group activities to be displayed as a single activity. This will however not create a Selection as the options above. Let's assume, we want to group the activities "Print and Send Purchase Order (Paper)", "Send Purchase Order (eOrder)", "Send Purchase Order (eMail)" and "Send Purchase Order Update". Click on any of these activities, and select "Group Activities". The following window will open:
Select all activities, and (optionally) name your group. The name will be displayed in the Selection Bar and in the Process Explorer.
Confirm your selection with
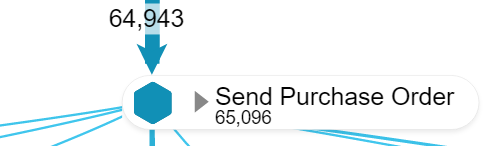
The new group will now combine all incoming cases.
To edit/ungroup the created group, right-click on the group and select "Edit Group" to add/remove activities from this group, or "Ungroup" to delete this group. With "Expand Group" you will temporarily dissolve the group. All included activities will show up in the Process Map again, with a small
| |||||||||||||||
| Expand | |||||||||||||||
| |||||||||||||||
| Expand | |||||||||||||||
| |||||||||||||||
The
|


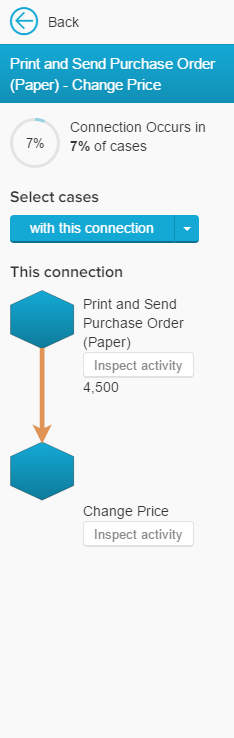
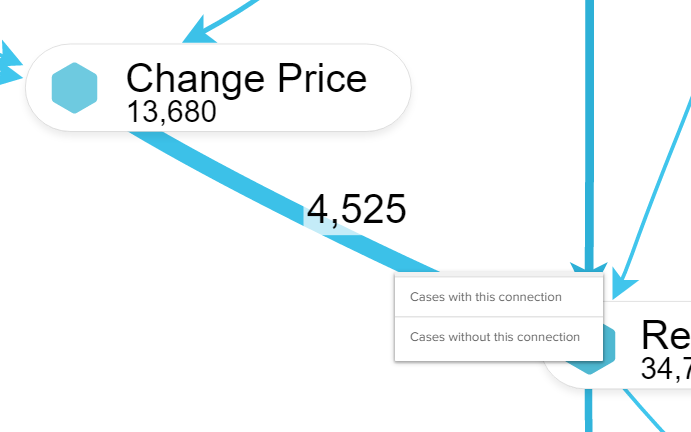
Connection Details
In the upper part, you will see the quantitive occurance of this connection, calculated upon your current Selection.
| Expand | ||
|---|---|---|
| ||
You can apply new Selections to get a deeper understanding of this connection using The white arrow on the right side will open a drop-down menu, offering the same selection possibilities as already explained above.
|

| Expand | ||
|---|---|---|
| ||
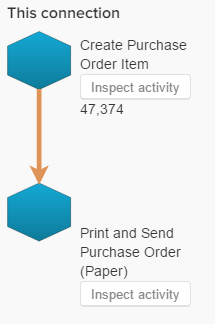
The "This connection" part shows both activities, that are attached to this connection. Use the |

Tools
In the upper left corner of your process map, you can find three symbols.
These are tools to advance and facilitate your process analysis.
The following tools are available:


KPIs
With the KPIs, you can change the displayed numbers next to the activities and connections.
Click here to learn more about the Process Explorer KPIs.
Inline Activity Chooser
Create a Selection with selected Activities.
Click here to learn more about the Inline Activity Chooser.
| Tip | ||
|---|---|---|
| ||
You might wonder which Process you are shown initially. The initially shown Process is called the Happy Path. The Happy Path shows the most frequent starting activity, the most frequent ending activity and the most frequent process variant which connects those two activities. |