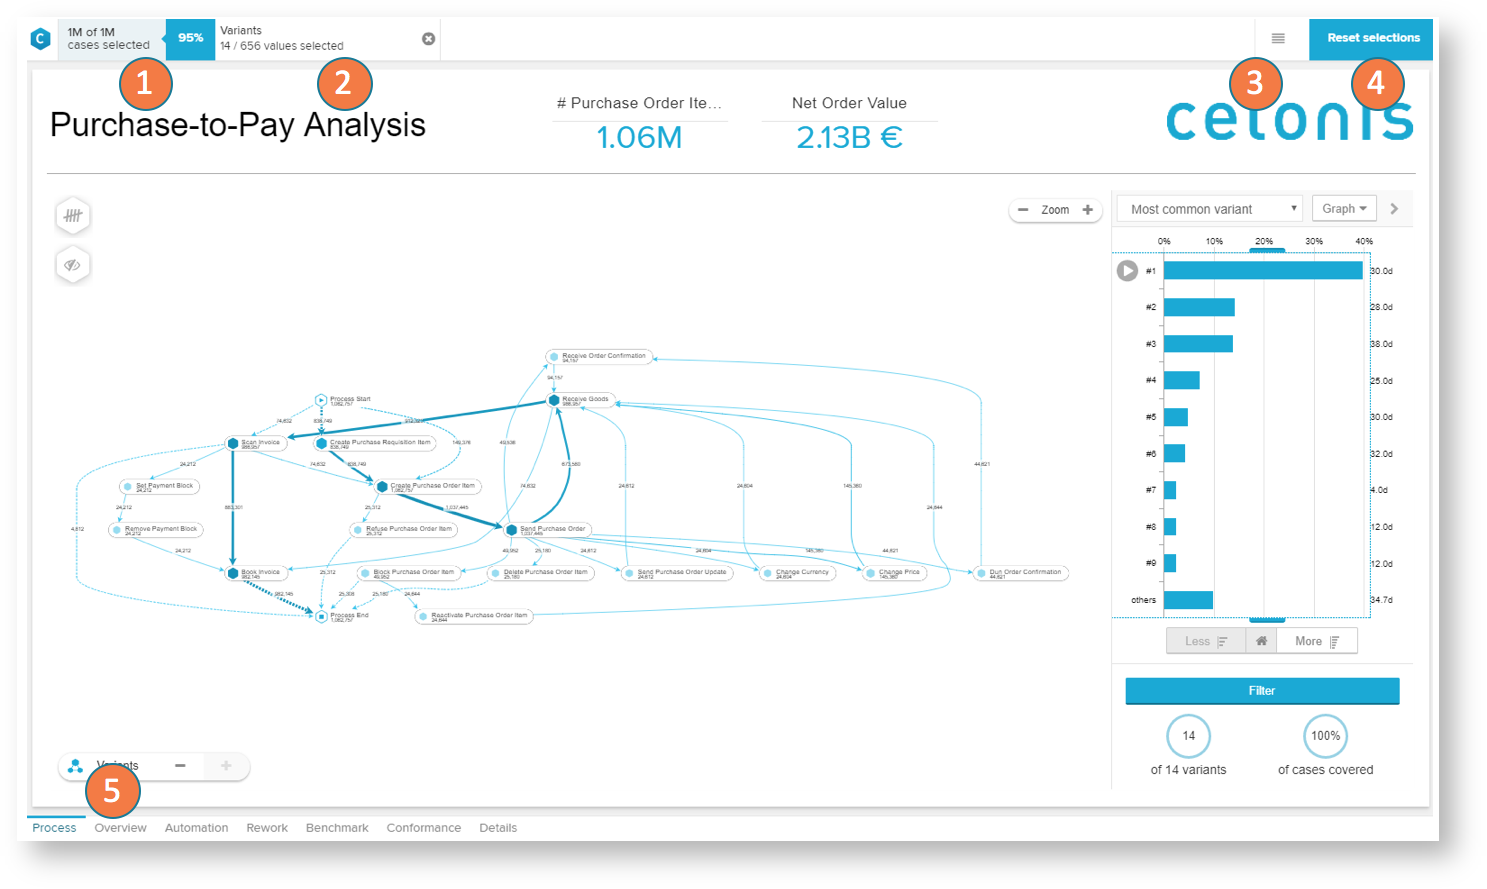
The Celonis analysis will present the content an analyst created for you.
- The case coverage at the top left shows you how many cases of the total dataset are currently selected
- The selection bar shows you which single selections are currently active on the analysis.
- The burger icon provides access to the analysis options.
- The reset button allows you to reset your current session. This will remove all current selections and resets the analysis to its original state.
- Analyses are structured in single sections. Those sheets can be navigated at the bottom of the view.
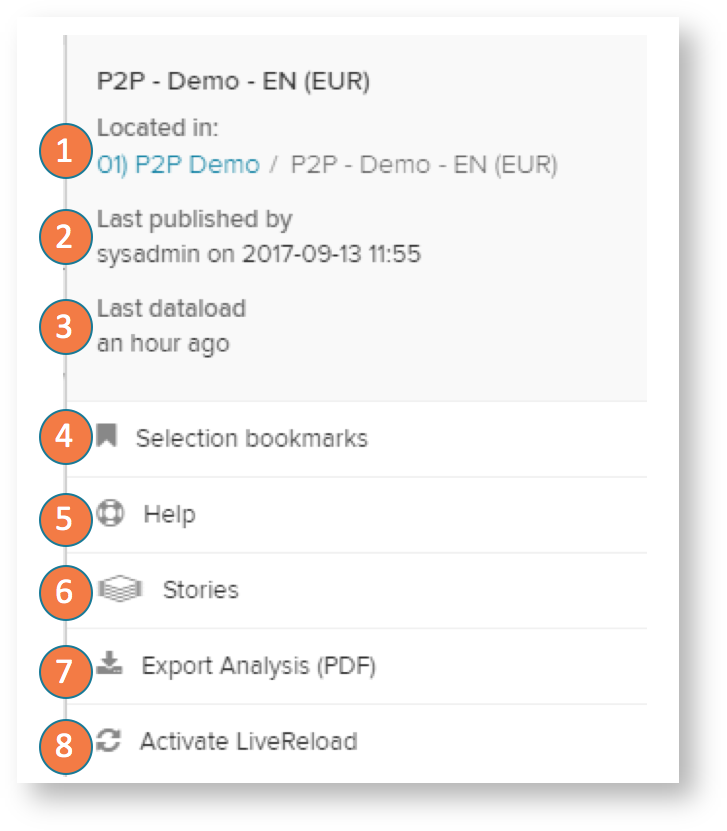
Analysis options
- Location: See the project, folder or subfolder in which the currently opened analysis is located.
- #Last published: This information shows you which user last published a new version of the analysis and when this version was published.
- Last dataload: Here you get shown when the last data load was executed.
- Selection bookmarks
- Help: Here you can open a help modal with access to the manual, service contacts, etc.
- Stories
- Export analysis (PDF): This option will export all sheets in the analysis in one document.
- Activate LiveReload: This option will switch in a live refresh session. The analysis session will be refreshed each 30s (can be changed in the URL) and update to the new data. New data points are automatically shown in the charts and visualizations.
| Info |
|---|
In contrast to the live refresh mode, in general the user session is kept until you explicitly reset your selections with the reset selection button at the top right or reload the page. The analysis is kept in the current state for each user to allow exploration of the interesting cases without interrupting the discovery phase on the process data |
Each Analysis Document consists of different parts.
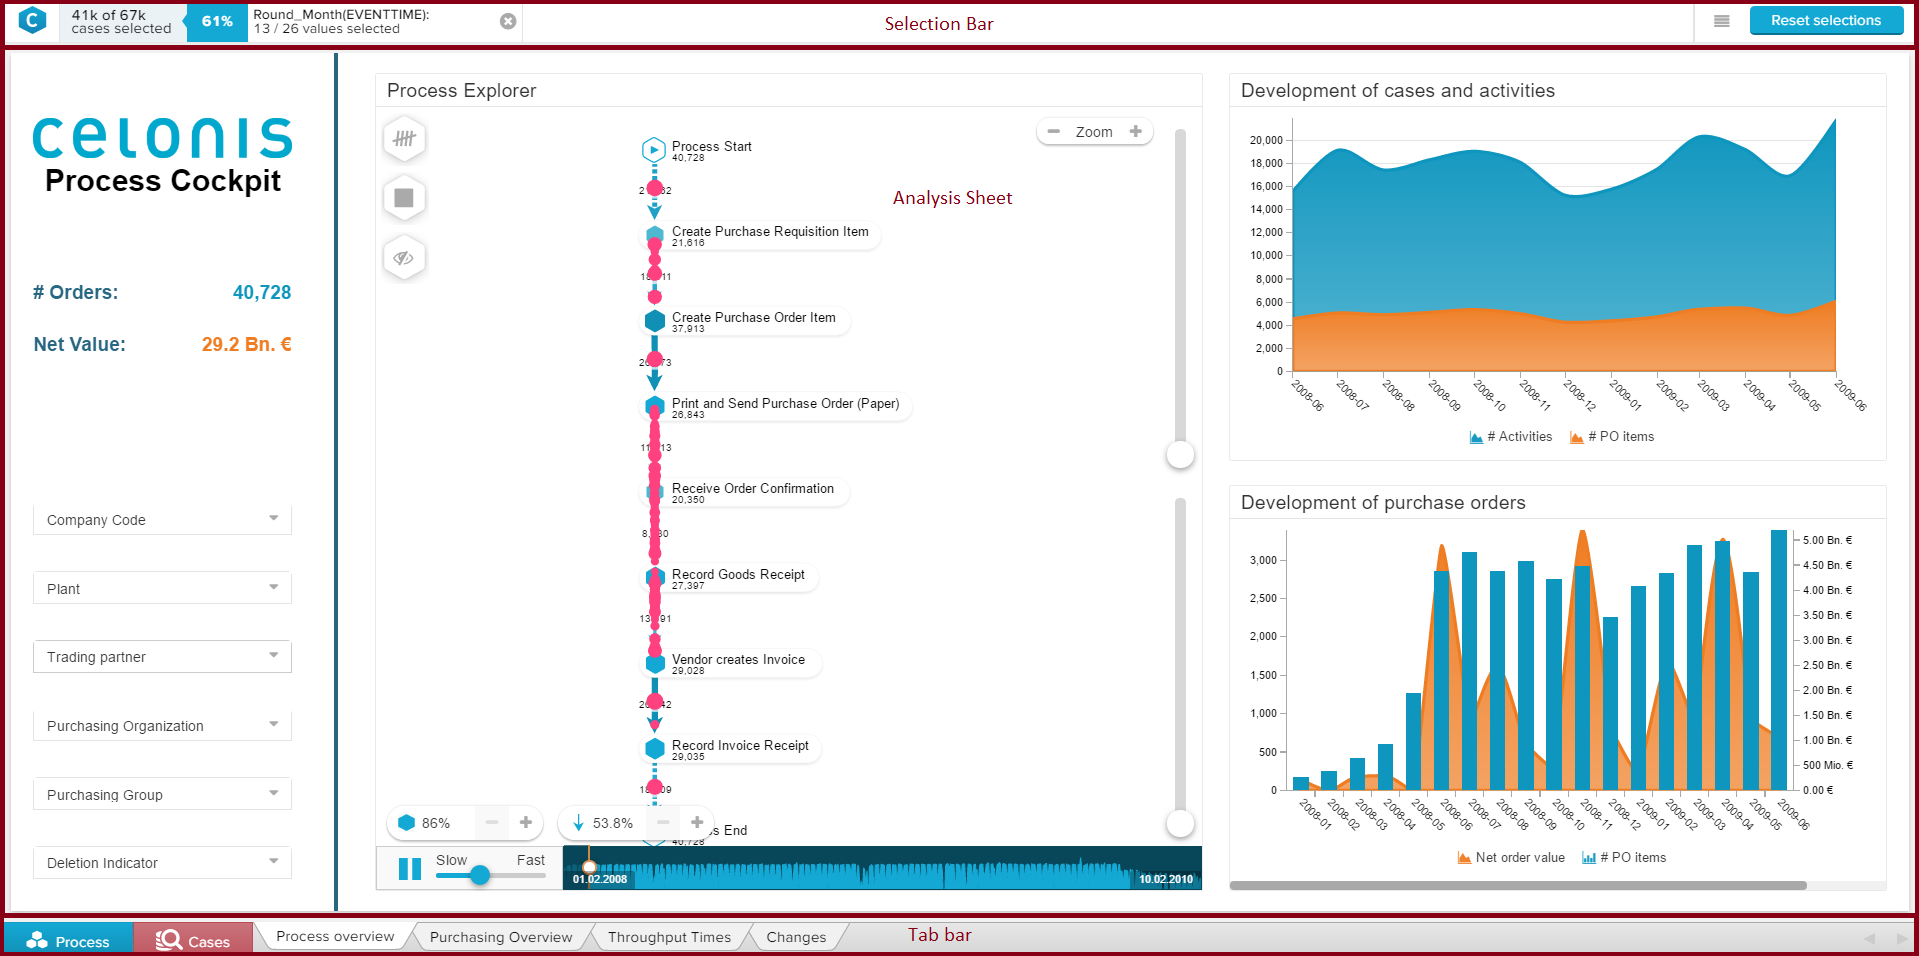
The Selection Bar displays all active selections.
A selection can be applied to any data from any component.
You can use selectoins to focus your analysis on a certain range of data, e.g. for the year 2015.
On the right side of the selection bar, you can furthermore access the document tools with the following icon: 
This will open a dropdown menu:
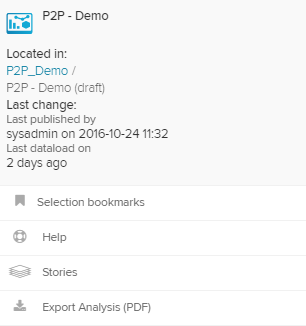
With these buttons, you can access the Selection bookmarks, open the help section (see below), create and manage your Stories, or export and download the current analysis document as a pdf-document to your local hard drive.
Every Analysis Document consists of one or multiple Analysis Sheets. They carry all Components and provide the user interface for your work with SAP Process Mining by Celonis 4.2.
To change between the different components, the Tab Bar has been introduced.

On the right side of the Tab Bar, you can see all available Analysis Sheets. Click on any sheet to open it
Help
The Help section can be accessed in the above described document tools.
The following help & support resources are available:
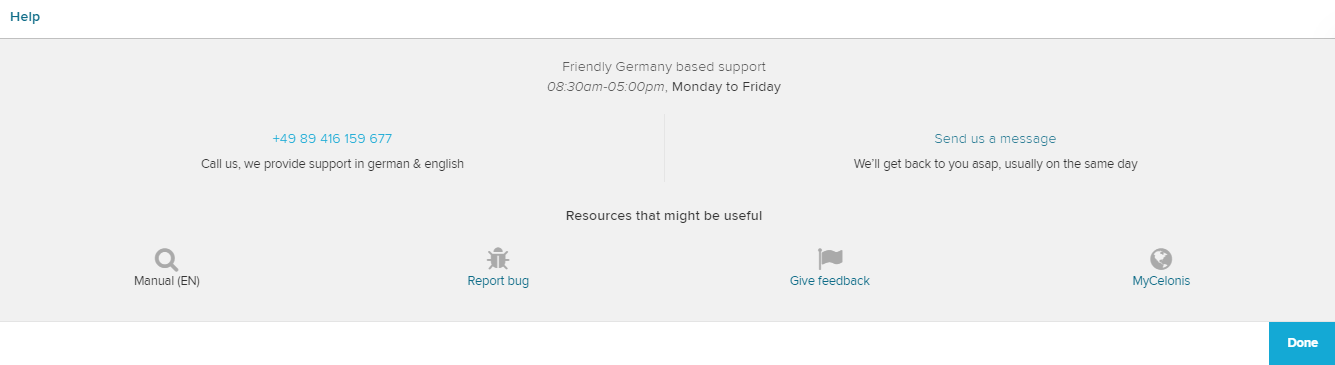
You can access this manual, report a bug (via e-mail), give feedback (via e-mail) or go to the MySAP Process Mining by Celonis plattform, where you can manage your licenses and access the Content Store and demo data.
Furthermore, you can at any time contact our Servicedesk!


Process Explorer
Click here and learn how to interact with the default Process Explorer.
Case Explorer
Click here and learn how to work with the Case Explorer.


Selections
Click here to learn how to apply your own Selections.