Custom KPI Views are additional KPIs that can bee displayed in the Process Explorer.
You should already be familiar with the default KPIs of the Process Explorer, which are available by default in all SAP Process Mining by Celonis 4.2 installations.
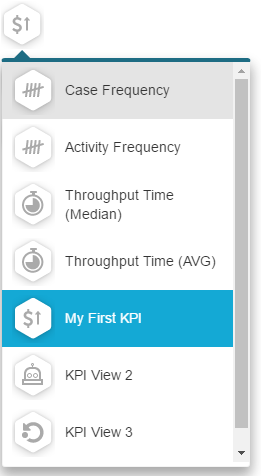
Choose the KPI views in the same place where you switch between the frequency Process Explorer and the Throughput Time Explorer: 
To add a custom KPI, choose  at the button of the drop-down menu, listing all existing KPIs.

In a KPI view, the analyst has to define activity KPIs and connection KPIs.
Add a new KPI view with:  .
.
You will see all possible configuration options in the right field.
Configure Custom KPIs
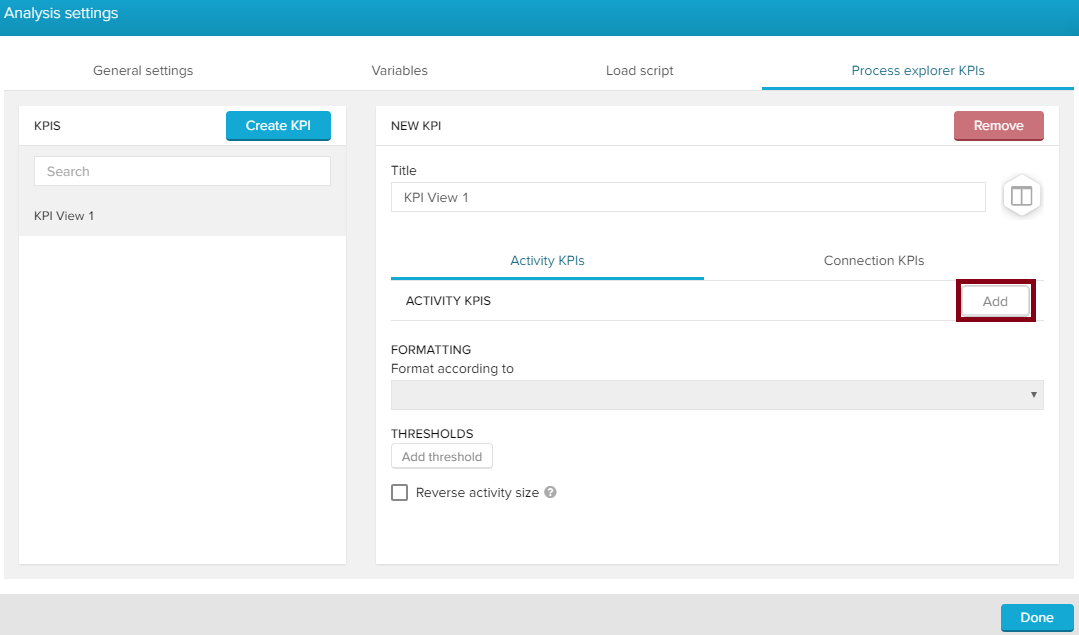
Activity KPIs
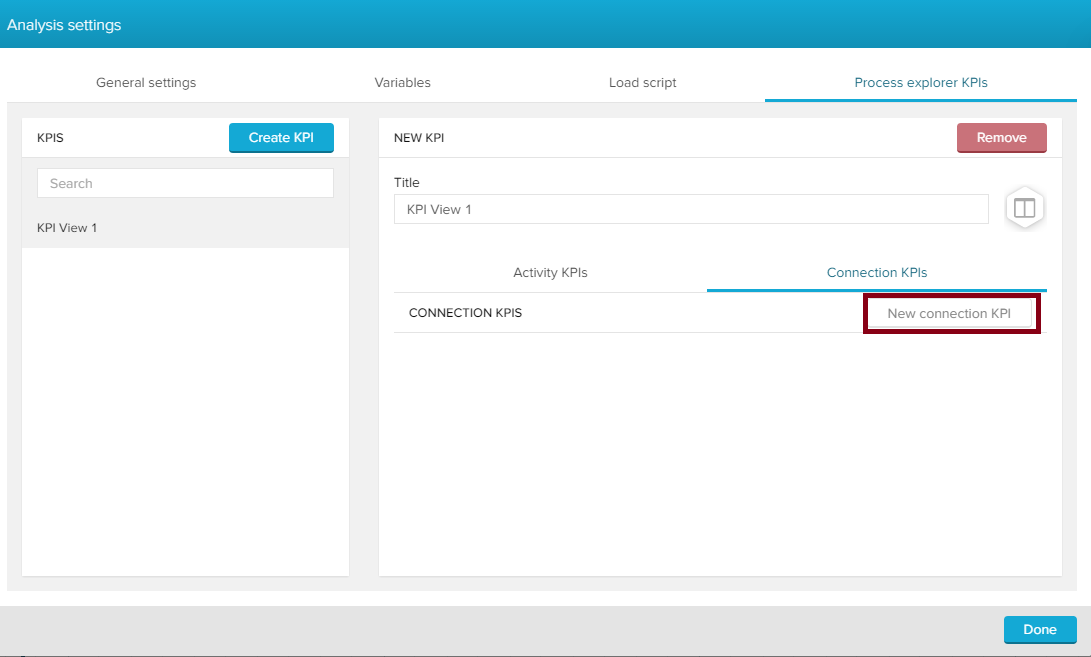
Connection KPIs
Click on the "Add" button to add a custom activity KPI.
Click on the "New connection KPI" button to create a new connection KPI.
Enter your PQL query in the "Edit Formula" field on the left side. You can make use of the KPI Builder, in order to prevent errors that may arise through misspelling.
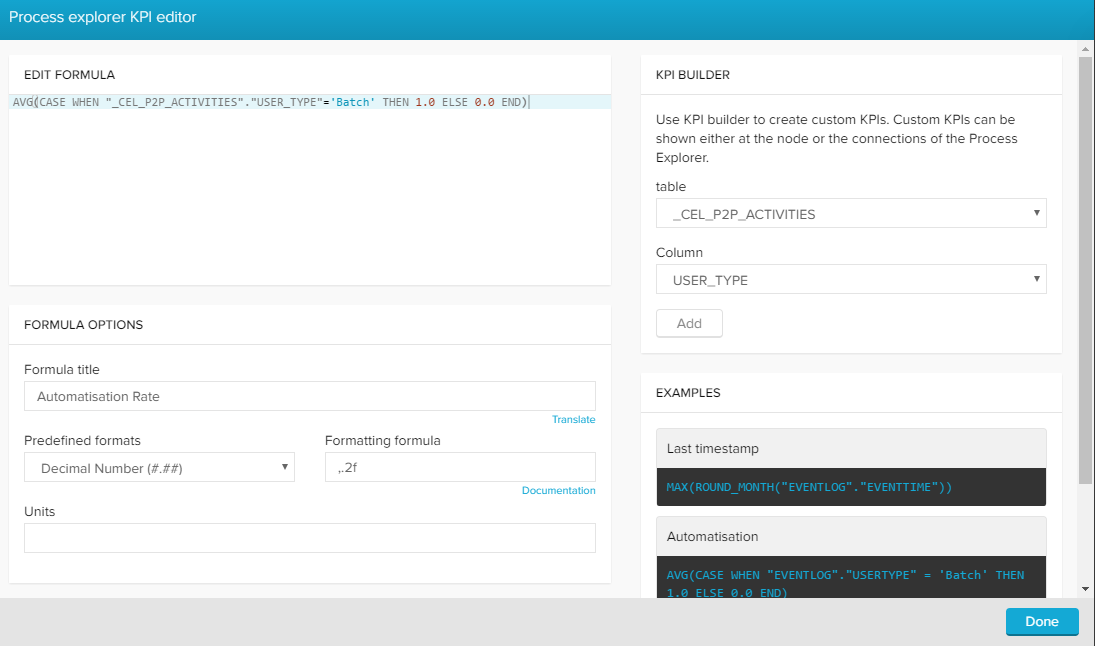
This sample activity KPI will show the automatisation rate for each activity, given that there is a generic user in the database (called 'batch') that is used when a process has been automated.
The following PQL query has been used:
AVG(CASE WHEN "_CEL_P2P_ACTIVITIES"."USER_TYPE" = 'Batch' THEN 1.0 ELSE 0.0)
If this activity has been automated, the KPI compiler will return 1.0, if not 0.0. After an iteration over all activities, this query will return a value between 0.0 and 1.0 for all activities.
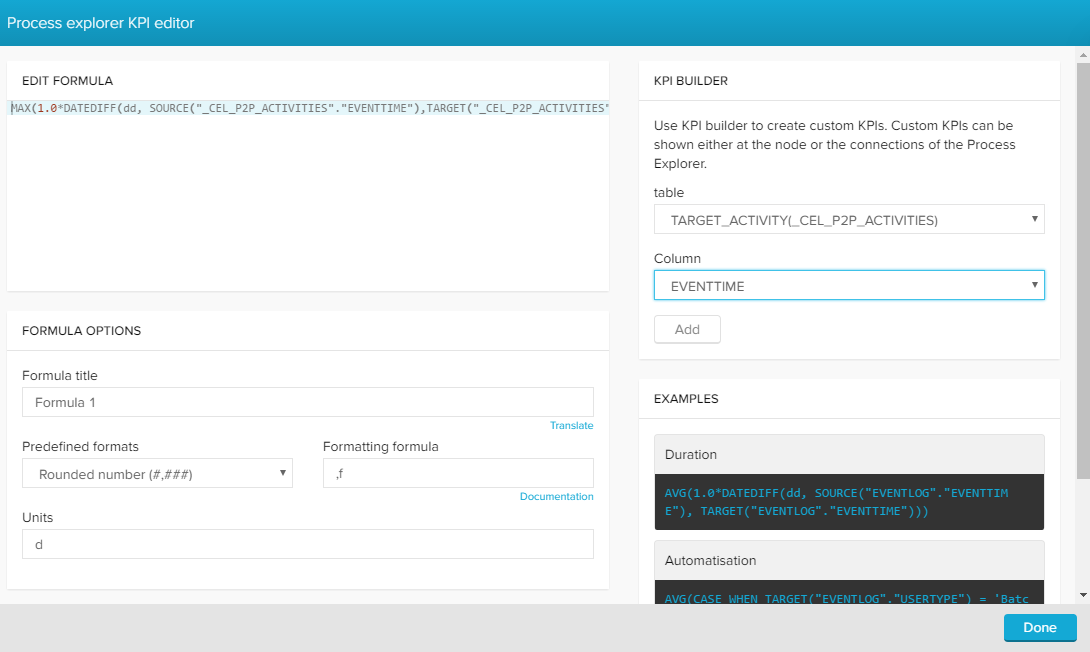
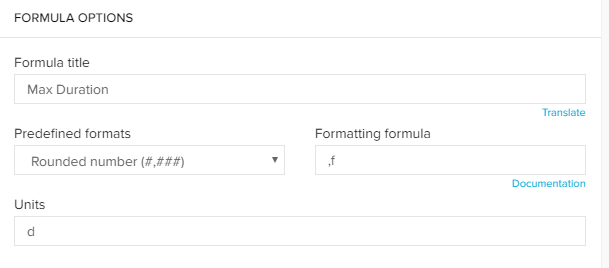
This sample connection KPI will provide the maximum duration of any case passing the connection (= the maximum throughput time).
The following PQL query has been used:
MAX(1.0*DATEDIFF(dd, SOURCE("_CEL_P2P_ACTIVITIES"."EVENTTIME"),TARGET("_CEL_P2P_ACTIVITIES"."EVENTTIME")))
This statement again iterates over all cases and compares for every connection the timestamp of the first activity with the timestamp of the last activity. For each connection, the maximum duration is selected and returned.
You can furthermore name your formula, and define formats and units:
Click on  to proceed.
Multiple KPIs
For every custom KPI view, you can add multiple activity KPIs and/or connection KPIs.
Simply repeat the instructions above.
Threshold value
To allow further restrictions on your KPI, you can add Threshold values.
Your activities or your connections can be colored according to definable thresholds.
Let's color all activities, that have an automatisation rate (see above) > 0.5 green.
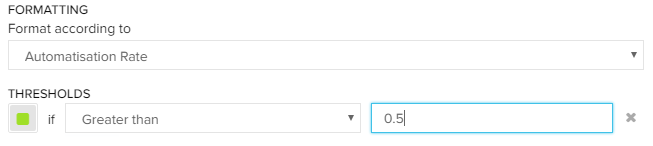
Save your threshold setting with  .
.
Multiple Thresholds
You can add multiple thresholds.
Reverse activity size
By default, activity nodes are scaled according to their KPI values. Larger KPI values will grow the activity node, smaller KPI values will decrease their size.
With the checkbox  , you can invert this scaling. Large KPI values will decrease the node's size, smaller KPI values will increase it's size.
Title & Format
You can name your new custom KPI view. This name will be shown in all process explorers throughout this analysis document.

Furthermore, you can select a symbol for your KPI view:
Save your changes with .
Now your process explorer has more KPIs!
Useful activity KPIs could be:
Useful connection KPIs could be: