The Process Explorer is the core element of SAP Process Mining by Celonis , a powerful instrument making it possible to visualize and analyze processes. In Figure 2.3 you can see an exemplary display of the process explorer, showing all its different features that will be explained throughout the following sections.
The Process Explorer was designed to show processes in the most intuitive and flexible manner: as process model. Different activities will be displayed as nodes, transitions between activities as edges. Every node and edge will show the total number of cases passing through it and edges can also be configured to adapt their thickness according to that number (that is highly frequented edges will be thicker than less frequented ones).
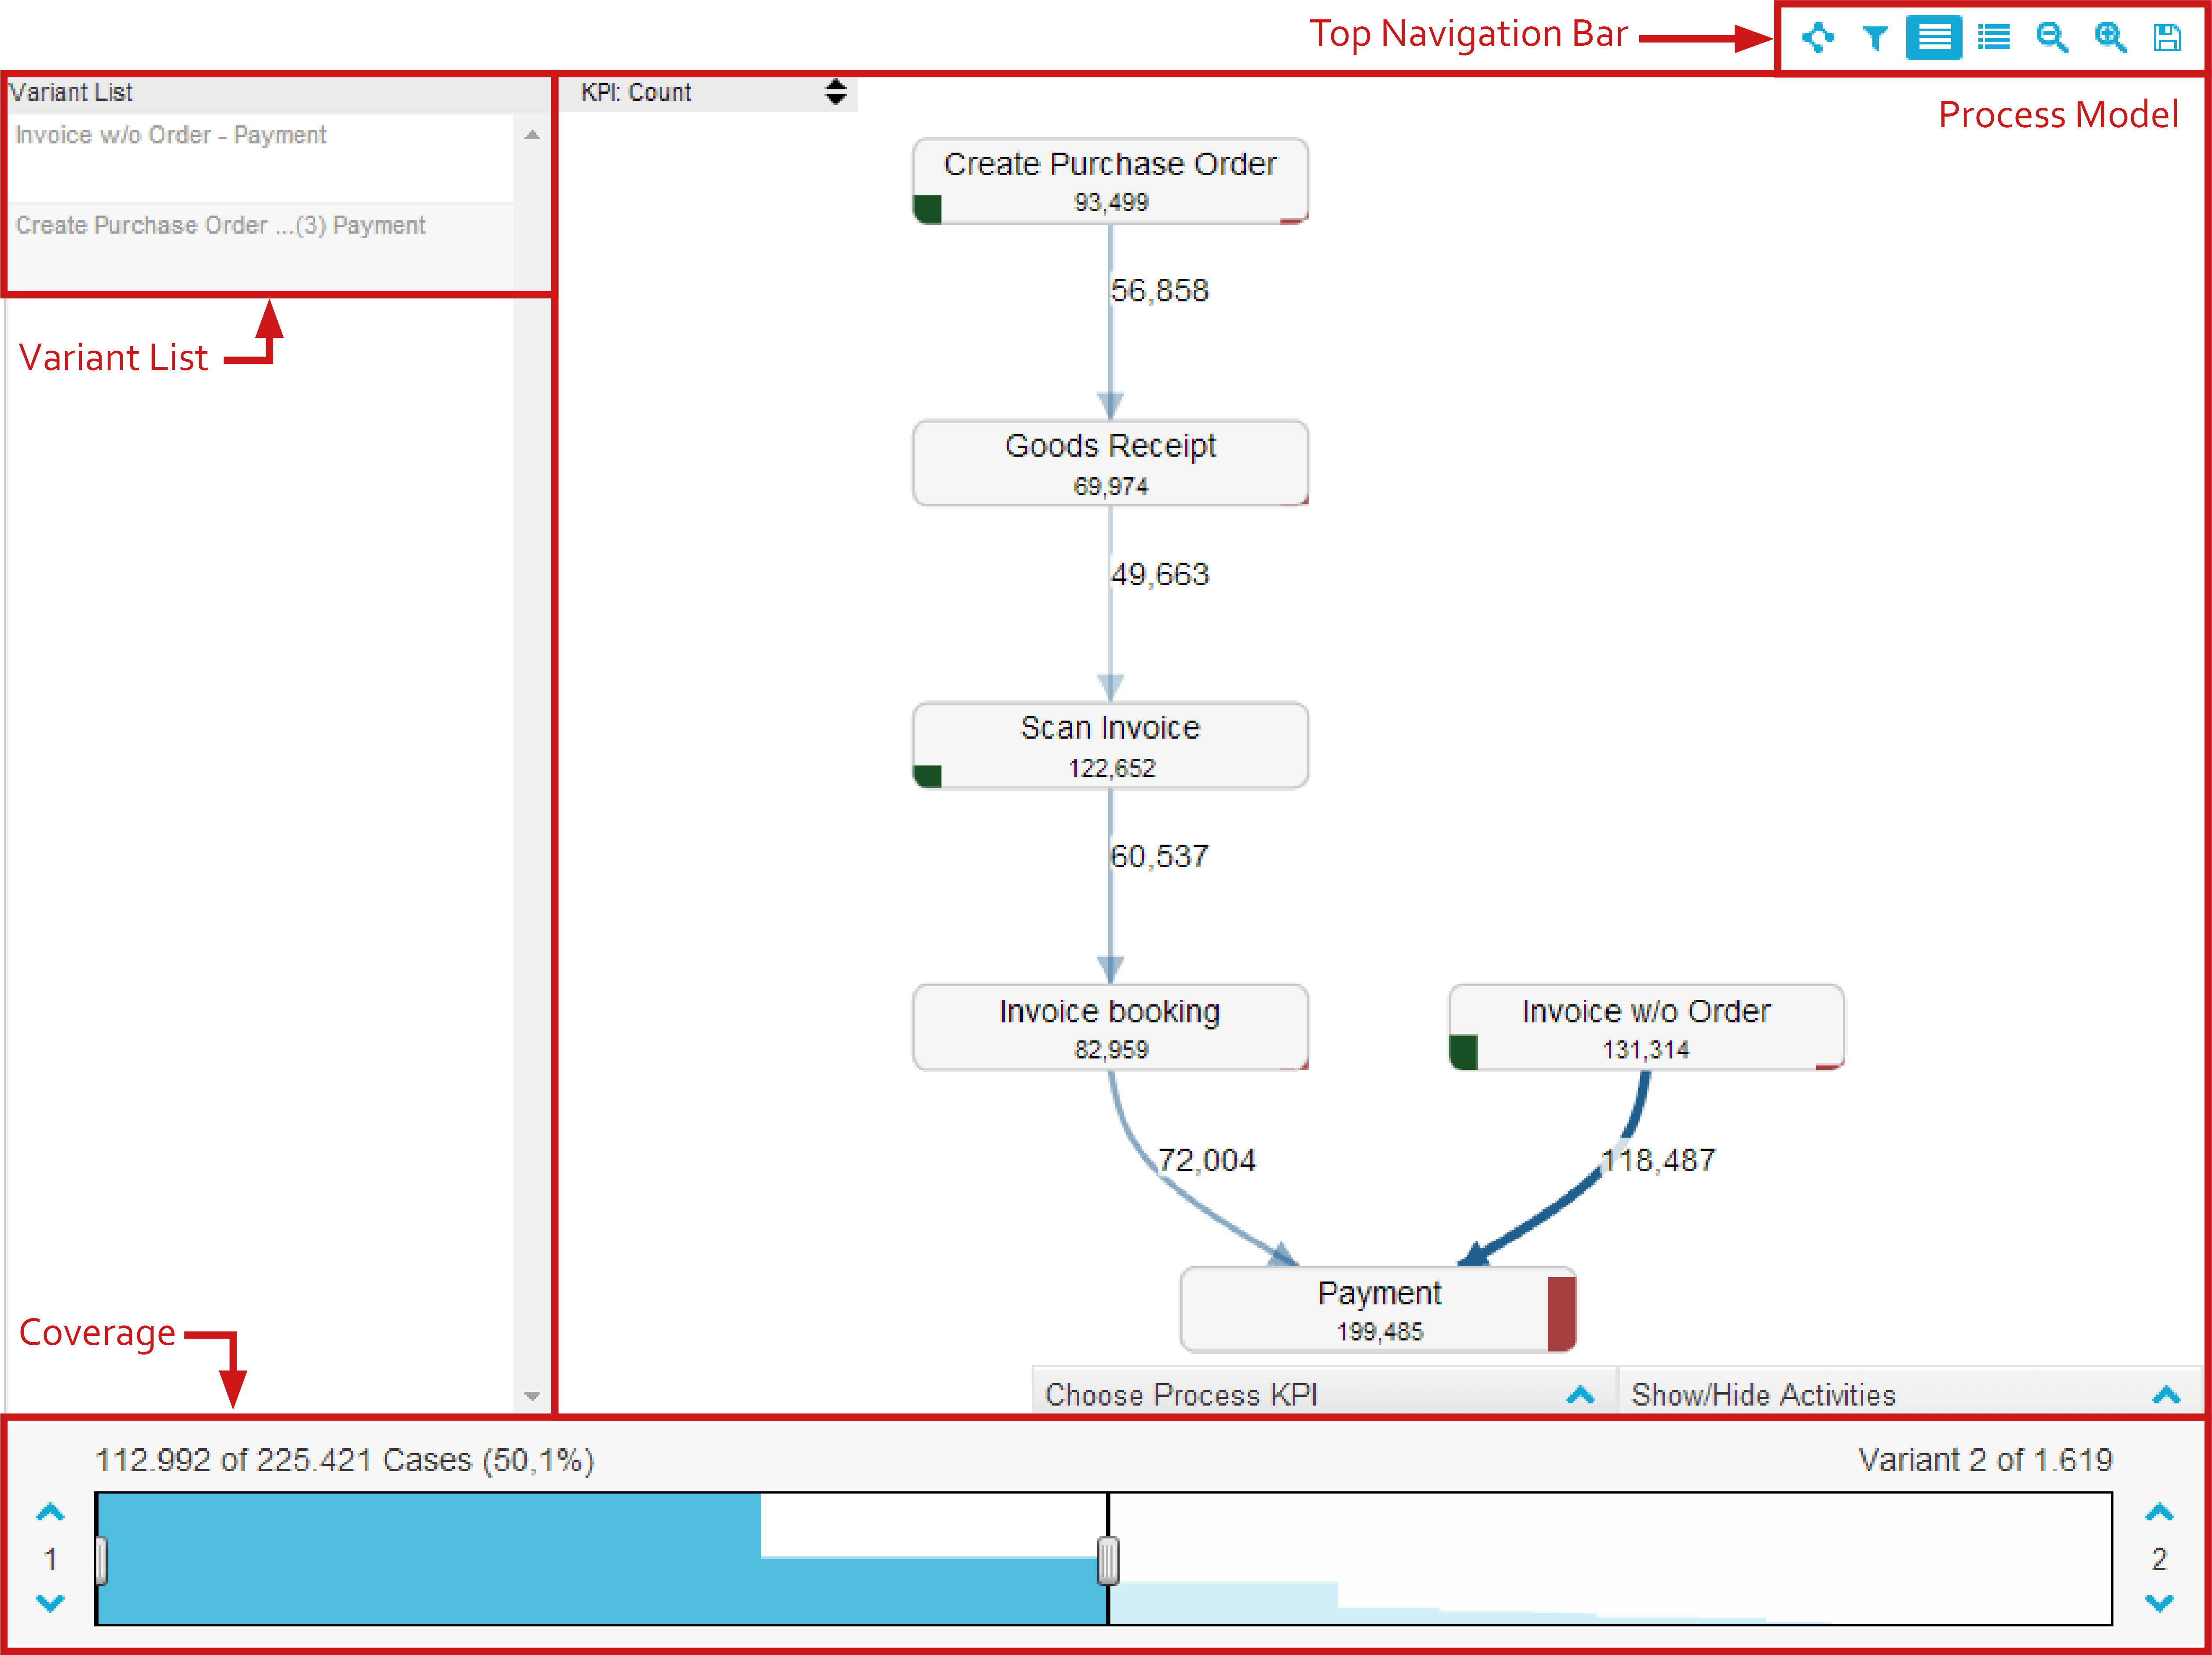
Figure 2.3: The Pocess Explorer - Overview
The Top Navigation Bar
The top navigation bar shows a maximum of eight different options, as displayed in Figure 2.4: Layout Options, Variant Filter, Display Variants, Display Case Viewer, Zoom out, Zoom in, Reset Selection and Save (from left to right). However, "Reset Selection" will only be shown, if any Variant Filters or filters on nodes or edges are activated. Consequently, the Top Navigation Bar only shows seven options in standard mode.

Figure 2.4: The Process Explorer - Top Navigation Bar
Layout Options
Clicking this option will give you the opportunity to choose between automatically or manually layouting your process model.
With automatic layouting, the system will arrange all nodes and edges such as to ensure maximum visibility of all numbers and texts as well as display nodes in their chronological order. Depending on whether you chose horizontal or vertical layouting, the order of the nodes will be aligned to either the horizontal or vertical axis.
After you clicked on Manual-Layout in the Layout Options-Menu, you can choose between horizontal or vertical layout. Depending on your choice, the system will automatically arrange nodes to either a horizontal or vertical axis giving you an ideal starting position for creating your own layout. Afterwards, manual layouting gives you total freedom in arranging nodes within your Process Explorer. Simply click and drag single nodes to move them to their specific position.
Vaiant Filter
Clicking on “Variant Filter” opens the Variant Filter menu, clicking on it again will close it. The Variant Filter allows you to easily activate and save different filters on process variants. In Figure 2.5 you can see an example configuration of a filter on all variants starting with “Scan Invoice”. Define a new Variant Filter by clicking on the small arrow pointing down in the top left corner of the menu and select “Add new Filter”.
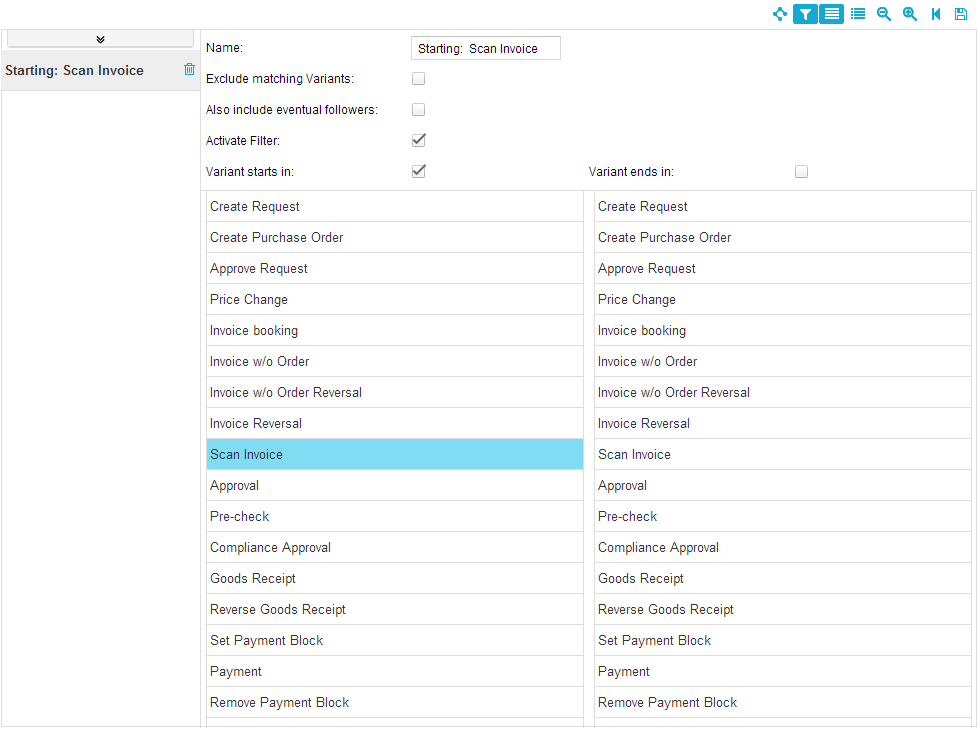
Figue 2.5: Process Explorer- Vaiant Filter
To configure a new filter, you need to choose starting points, end points or both.
To define starting points for the process, activate Variant starts in and select one or more activities from the options given below. To define end points, activate Variant ends in and also select one or more activities from the options given below. Starting and end points can either be used separately or in combination. For example by filtering on all processes starting with “Scan Invoice” and ending with “Payment” all processes whose first activity was “Scan Invoice” and whose last activity was “Payment” will be selected and displayed after the Variant Filter was closed.
If you use starting and end points in combination, potential activities the process runs through in between starting and end points will by default not be shown. This means, that only processes which started with the activity (or the activities) defined as starting point and directly afterwards ended with the activity (or the activities) defined as end point will be displayed. If you also want to show processes that run through other activities between starting and end points, you need to activate the option Also include eventual followers.
By activating Exclude matching Variants you can invert the filter applied. This means that only those process variants that are not in accordance with the filtering options selected will be shown.
Every new Variant Filter you configure will be saved and shown in the list of options on the left side of the Variant Filter menu. By selecting a filter and clicking on Activate Filter you can decide whether to use it on the current process model or not. This gives you the opportunity to flexibly switch between different filters. You can delete filters by clicking on the rubbish bin icon shown next to them in the filter list.
Display Variants
Clicking on this option will fade in a list of all available variants on the left side of the Process Explorer. An example of this is shown in Figue 2.3 where the option is activated and the variant list can be seen next to the process model. The Variant List will be explained in more detail later on.
Display Case Viewer
Clicking on “Display Case Viewer” will show you an overview of all the cases the process model is based on in a table. Clicking on it again will let you return to the process model overview. After clicking on one case, all activities occurring within it will be listed in a separate table below the Case Viewer. The Case Viewer is a convenient tool for getting a first impression of cases and their respective activities. In Edit Mode, details of the Case Viewer can be set as explained here. For a more detailed examination of single cases, the Case Explorer, which will be explained in more detail in the next Chapter, can be used.
Zoom out
Once you have heightened coverage (details about coverage will be given later on), your process model will show more and more different variants, process nodes and process edges. To keep an overview over all nodes involved, simply zoom out. The process model will become smaller, making space for even more variants. Zooming out (and in) can also be achieved by scrolling your mouse anywhere inside the Process Explorer.
Zoom in
Click on “Zoom in" to be able to look at certain spots of your process model in more detail. The process model will become bigger and thus more easily readable. Zooming in (and out) can also be achieved by scrolling your mouse anywhere inside the Process Explorer.
Reset Selection
This option will only be shown, if you applied Variant Filters or filters on process nodes or edges. Activating it will remove all filters selected and the process model will return to its original state.
Save
By saving the process model, a png-image of the Process Explorer will be generated and stored in your home directory. You can access your home directory by clicking on "MyFiles" in the Navigation menu. This option will not save your analysis in a state that can be reproduced by the SAP Process Mining by Celonis system!
To save your whole analysis to the SAP Process Mining by Celonis system, you need to select “Document” and then “Save” in the topmost navigation bar of the user interface (if you are in possession of the respective user rights).
Interaction with the Process Modell
Besides zooming in and out of the process model by scrolling with your mouse, the Process Explorer also allows for other interaction giving you further insight into how your processes have been conducted.
Information given by (clicking on) Nodes
Some information can already be gained simply by looking at the process nodes. Here, the total amount of cases running through the node is given as well as a visual representation of the amount of cases starting or ending with the activity, represented by the green and red bars shown on some of the nodes. The green bar stands for cases starting with the activity, the red bar for cases ending with it. The higher the bar, the more cases have started or ended with the activity.
More interaction with the process model can be achieved by clicking on the nodes and using the node menu shown in Figue 2.6. In addition to the information visible before, here total amounts of cases starting or ending in the node are given. Also, in case nodes have been hidden and cases start or end with these hidden activities (for more detail about hiding nodes see Show or Hide Activities), the number of cases starting in a hidden activity before or ending in a hidden activity after the node selected are displayed.
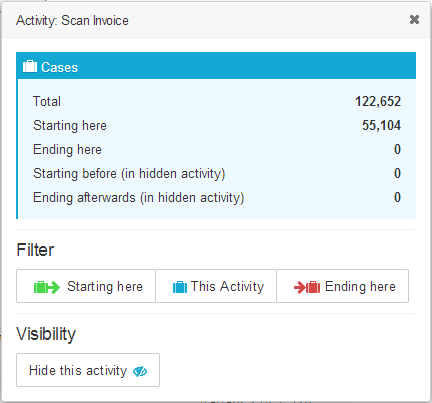
Figure 2.6: Process Exploer - Node Menu
The node menu also gives you the opportunity to directly apply Variant Filters without switching to the Variant Filter menu. All process variants starting or ending with the activity represented by the node can be selected by clicking “Starting here” or “Ending here”. Selecting “This Activity” will result in the display of all cases that have incorporated the activity as one of their process steps.
Visibility settings of the node selected can also be made within the node menu. By clicking on “Hide this activity” the activity will be removed from the process model. Hidden nodes can be made visible again by making use of the options given in the “Show/Hide Activities” menu that will be explained later on.
Information given by (clicking on) Edges
The process edges as well provide information simply by looking on them. Depending on the selected Process KPI (for definition of Process KPIs see the next section), the information given on a process edge will show the number of cases running through it, the average cycle time or any other KPI you might have defined.
By clicking on a process edge, you can open the edge menu. An example can be seen in Figure 2.7. On the left side of the menu you can see the number of potentially hidden activities that might lie between the previous and the next activity of the process edge you selected. If there are any hidden activities, clicking on “Show” will make them reappear. On the right side you can see general information about the different process KPIs. For the standard KPI “Cases” this will be the number of distinct cases running through the edge as well as the total number of times the process edge is run through. For the standard KPI “Duration” this will be the total, average, minimum and maximum amount of time it took for processes to transition from the edge’s previous activity to the next.
Of course you can also use the selected edge as a filter for your process model. By clicking on “This step” only those variants will be selected, that contain the selected transition somewhere in their process flow.
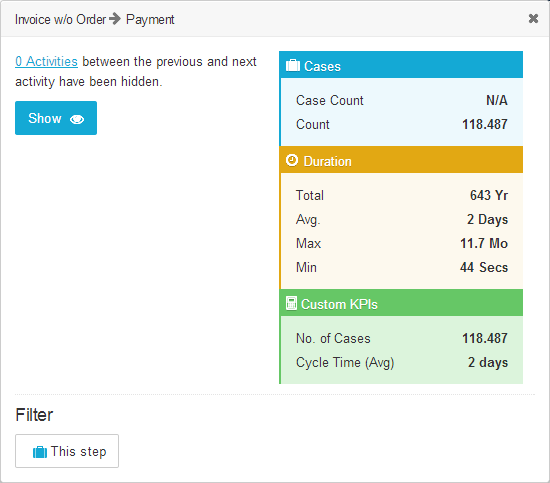
Figure 2.7: Prcess Explorer - Edge Menu
Choose Process KPI
SAP Process Mining by Celonis allows for the configuration of different process KPIs that can be used on the process edges. The configuration of KPIs cannot be done in View-Mode. However, by clicking on the dropdown menu in the top left corner of the Process Explorer, a list of all process KPIs available will fade in. Simply select the process KPI needed and it will be applied to the edges in the process model.
Show or Hide Activities
Next to “Choose Process KPI” you will find another menu for adapting your process model: “Show/Hide Activities”. Opening it will reveal a list of all activities available within the process model. All selected activities will be shown, deselected ones will be hidden from view. Select the important activities and hide the ones irrelevant for your current analysis, afterwards click on “Apply” to save your changes.
Coverage & Variant List
Coverage
At the bottom of the Process Explorer you will find the coverage bar shown in Figure 2.8 that allows you to change the coverage used within your process model. At a very low coverage level, the process model will only show the most common process variants. The higher the coverage, the more variants will be included into the process model.
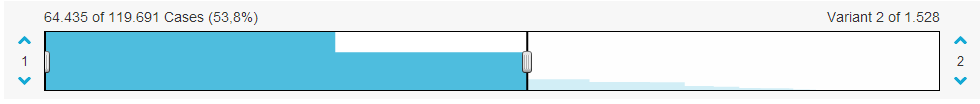
Figure 2.8: Process Exploer - Coverage Bar
Information given on Top of the Coverage Bar
On top of the coverage bar, you will find information about the total number of cases available and about the number of cases being shown in the process model at the moment. In addition to that, coverage is given as a percentage. For example, 50% coverage means that 50% of all cases, ordered by the commonness of their process variants, will be shown in the model. Coverage of 100% will show all cases and thus all variants, even highly uncommon ones. The coverage bar also gives you information about the total amount of variants available and the amount of variants displayed in the model at the moment.
Using Coverage Control {#usingcoverage}
You can move coverage up and down by using the coverage control buttons (  ) on the left and right side of the coverage bar. Coverage control on the right side of the bar can be used to add or remove increasingly uncommon variants (by clicking the arrow pointing either up or down). By using coverage control on the left side the most common variants will be taken away from the model, leaving only the uncommon ones.
Coloring of Coverage Bar {#coloringofcoverage}
The coloring of the coverage bar intuitively provides information about how many of the occurring cases can be explained by how many variants. In the example provided in Figure 2.9, roughly half of the cases available (53,8%) can be explained by only two variants. The higher the coverage the fewer cases can be explained by single variants. That is because variants become more uncommon, meaning that they are incorporated by only a few cases.
Variant List
The higher the coverage, the more variants will be included into the process model. That is why SAP Process Mining by Celonis keeps track of all available variants in a list that on request (meaning after pressing the Variant List option in the top navigation bar) can be shown on the left side of the Process Explorer.
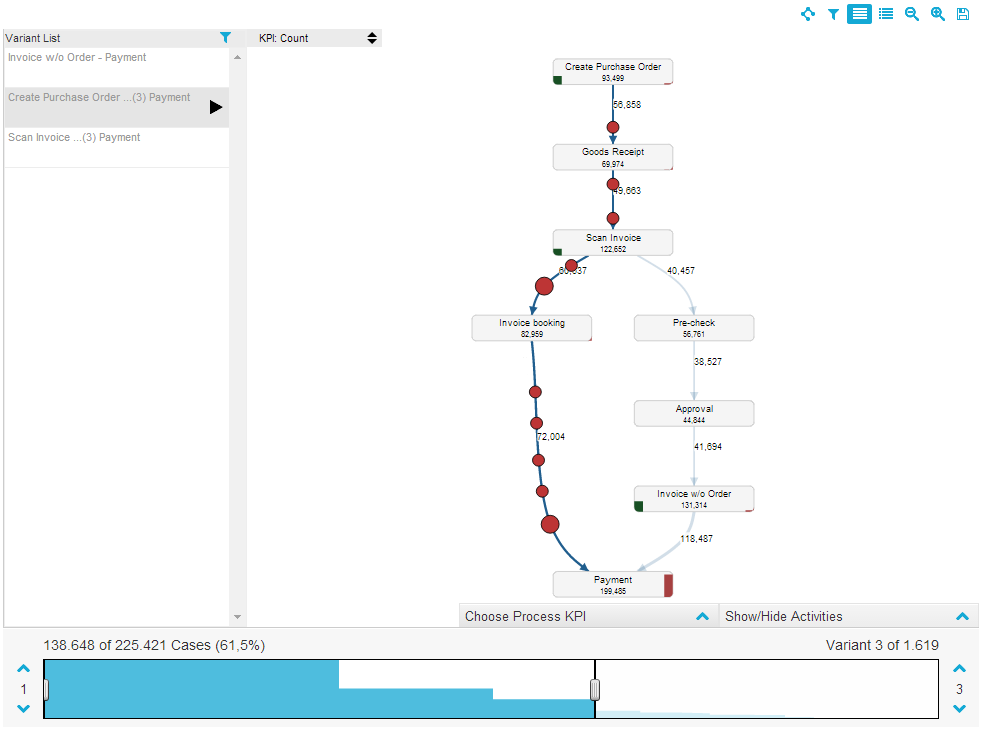
Figure 2.9: Process Explorer - Vaiant list
Figure 2.9 shows an overview of the variant list and its features like highlighting and animation that will be explained in the following sections.