The Line Chart is very similar to the Time Series Chart.
However, in contrast to the Time Series Chart, the Line Chart was not purposefully designed for time dimensions and can be used with any kind of dimension data. An example for a line chart can be seen in Figure 2.15. Since its functionality equals that of the Time Series Chart, please refer to the section about the Time Series Chart for further information.
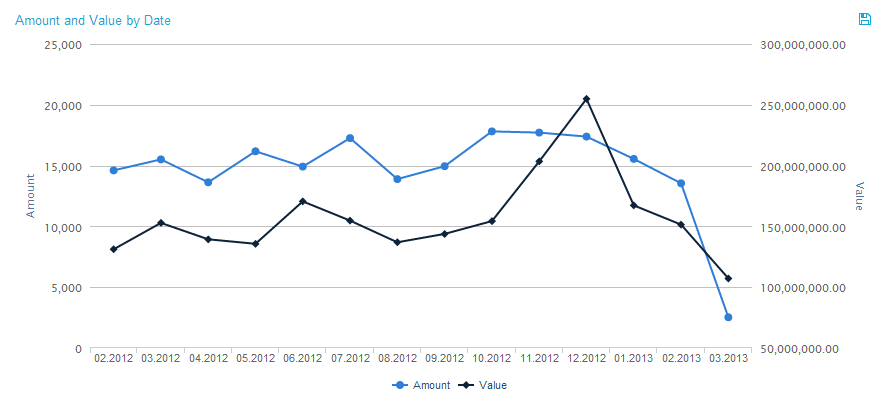
Figure 2.15: The Line Chart