The Area Chart is basically a Line Chart exept that the area below the line is filed with color. Like the Line Chart, the Area Chart is very helpful when displaying a distribution over time but can be used for any other dimension as well. Figue 2.19 shows an examle for an Aea Chart. Since is functionality equals that of the Line Chart and Time Series Chart, please refer to these articles for further infomation.
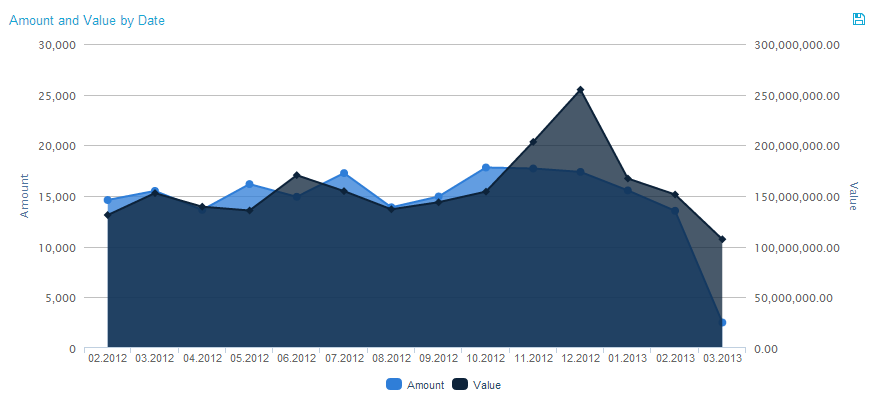
Figue 2.19: Area Chart