The Bubble Plot is an extension of the Scatter Plot. If a second aggregation is used, that aggregation will determine the size of the bubbles in the plot, which make the Bubble Plot more intuitively understandable. In comparison to Figure 2.24, in Figure 2.25 the size of the bubbles is defined by the number of tickets "contained" in each bubble, i.e. there are many tickets that are forwarded zero times and only few that are forwarded more than three times.
Since its functionality equals that of the Scatter Plot, please refer to the section about the Scatter Plot for further information.
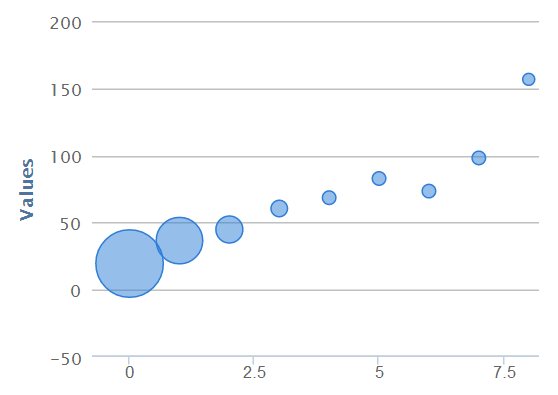
Figure 2.25: The Bubble Plot