In addition to the options explained in The Analysis View, users with write access to an analysis will have access to another menu in the navigation bar (see the Active Tab menu in Figure 3.1) and be able to use new entries in the other drop down menus as well as switch to Edit-Mode in contrast to only View-Mode.

Figure 3.1: Navigation Bar
Document
Under Document you will now also have the possiblity to save any changes you made to the analysis (please keep in mind that these changes will be visible to all users) as well as to Save to another document which will create a new document or rather a copy of the current document only visible to you.
Tools
Tools includes the very important option Filters which allows you to restrict the whole analysis (not just the tab) to a certain data selection. When clicking on it the Filter List will appear. Pressing the Add Filter button allows you to either define a PQL Filter (this is for advanced users only knowing PQL syntax and the accurate field names including table prefixes) or you can choose one of the tables contained in the data cube and then simply select a field of this table.
Active Tab
The new menu Active Tab will allow you defining the Settings of the tab you are currently working on (see Figure 3.2).
- Tab Title: Assign a meaningful title to your tab, corresponding to its content.
- Grid Width: Defines the granularity of the "drawing" area. A low value will allow you to position your elements without any limitations but making it hard to align elements. In contrast, a high value will only allow you to position elements according to the grid, providing the benefit of clear alignment of the components.
- Resolution Guide: Activating the Resolution Guide (Tick the box at Show Resolution Guide) will return you an area according to the selected resolution (Show Resolution Guides at...). This can help you to prepare and place the objects according to the correct resolution of a beamer or an external monitor for presentational use.
- Background Image: If you wish to do so you can define a background image that you have uploaded previously. To see the background, tick the box at Use Background. If you want to repeat your background image, select Repeat Background.
- Tab Position: Gives you the possiblity to change the order of the tabs by moving the current tab to the left or right.
- Load Automatically: This option will make the tab refresh automatically when the analysis is opened (if deactivated the analysis has to be loaded manually by clicking the refresh button in the top right corner of the analysis).
- Filter: Here you can define a filter for the current tab only (in contrast to the filters you define in the tools menu that function globally for the whole analysis) in [PQL syntax](#pqlsyntax).
- Direct Link: Here, a direct URL to the current tab is provided.
- Tablink: Provides a PQL link, which can only be used in SAP Process Mining by Celonis 3 and can be modified with an adaptable text ('YOUR TEXT').
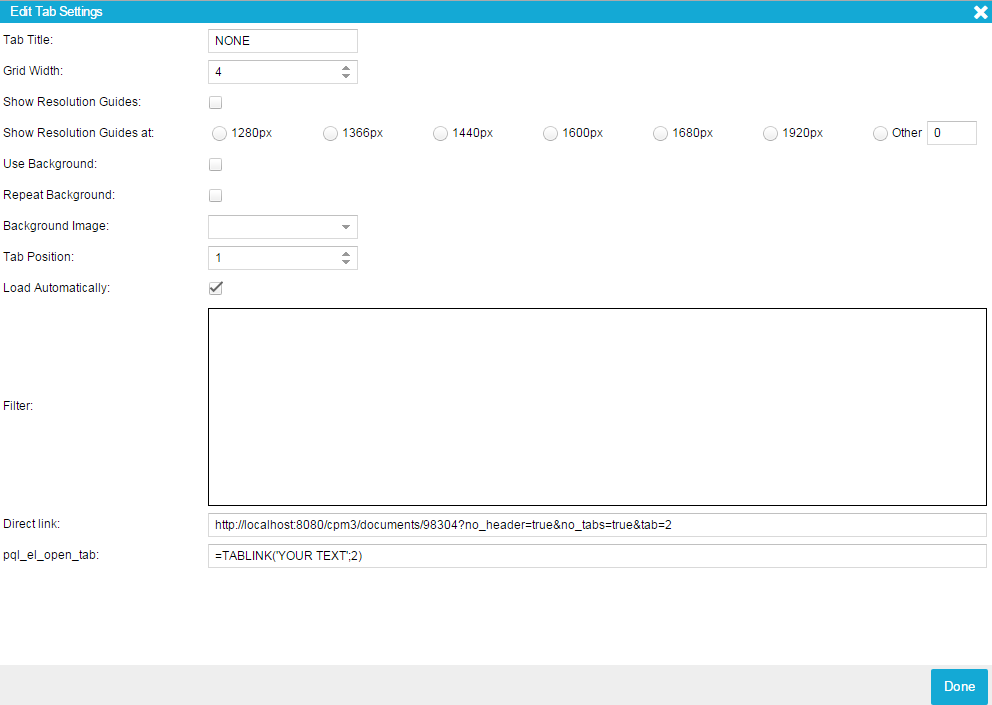
Figure 3.2: Active Tab Settings
User Modes
Users with write access will be able to change the mode from View to Edit, allowing them to add New Tabs as well as to modify and add new components to the layout area. When entering Edit Mode, a range of new icons will appear on top of analyses components offering you enhanced editing options. These icons can be seen in Figure 3.3.
![]()
Figure 3.3: New Icons available in User Mode
The first one will let you enter the configuration menu where you can edit the settings made for the respective component. The configuration options for the different components will be explained in Chapter 3.3.
The second one allows you to resize as well as change the position of the component. Once you clicked on it, the component’s contents will temporarily diSAP Process Mining by Celonis pear and it will look as shown in Figure 3.4 Select one of the four corners now marked in blue and pull the component to the desired size. Via the ![]() -Button you can choose the right position. Once the correct size and position of the component has been established, click on the blue check mark. The component’s content will then reappear.
-Button you can choose the right position. Once the correct size and position of the component has been established, click on the blue check mark. The component’s content will then reappear.

Figure 3.4: Changing Size and Position of a Component
Clicking on the last icon, the small rubbish bin, will delete the component from the analysis. Click on the large rubbish bin appearing after you clicked on the icon to permanently delete the component or choose the arrow pointing backwards to abort and return to the previous state.