SAP Process Mining by Celonis also offers some other components that are mainly for layouting purposes. Including these can help structuring your analysis and making it more easily understandable.
Free Text
Adding text to your analyses can help users to understand the single components more easily. With the free text components, you can for example add some explanations next to the components you inserted into your analysis or provide headlines for its different sections. The Free Text configuration menu can be seen in Figure 3.19.
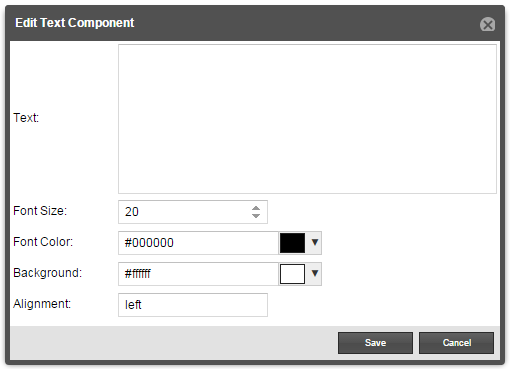
Figure 3.21: Free Text Configuration Menu
- Text:Add here the text you want to show in your Free Text component.
- Font Size: Specify the size of the font. Use large font sizes for headlines and smaller ones for explanations.
- Font Color: Specify the color of the font. Choose the color either by using the color picker appearing once you click into the input field or by typing the labels of common colors such as “black”, “white”, “red”, “blue”, “green” and “yellow”.
- Background: You can add a background color to your Free Text component. Choose the color either by using the color picker appearing once you click into the input field or by typing the labels of common colors such as “black”, “white”, “red”, “blue”, “green” and “yellow”. The default value will be set to “transparent”.
- Alignment Insert “left”, “right” or “center” to align your text to the left, right or center part of your component.
Image
With images you can ease the look of your analysis. When creating a company template, this component is also useful for including your company's logo.
When selecting the Image Component you will see a list of all the files you have previously uploaded to the SAP Process Mining by Celonis system. If no files have been uploaded yet, the list will be empty. Either choose one of the files available in the list any click on “Save” or use the “Upload” button to upload a new file from your computer and specify a name for it.
After clicking on “Save” the image will appear in your analysis and can be moved to an appropriate place.
Selection View
The Selection View component is a simple yet very useful feature for showing the filters currently applied in your analysis. No configurations need to be made. After choosing the Selection View from the components menu, it will immediately be inserted into your analysis and will be empty at first. Once you made a dynamic filtering selection within one of your analysis components, the Selection View will show all the filters currently applied as plain text.
Line
Lines are very useful for structuring your analysis for example by creating different sections. After choosing the Line Component from the components menu, there are some configuration options available.
- Line Type: Choose if you want to insert a horizontal or vertical line.
- Line Thickness: Choose how thick you want to line to be. The higher the value, the thicker the line.
- Line Color: Define here the color of the line. Choose the color either by using the color picker appearing once you click into the input field or by typing the labels of common colors such as “black”, “white”, “red”, “blue”, “green” and “yellow”.
- Coordinates: Select the X- and Y-coordinates you want your line to show up initially. Of course, the position of the line can also be adapted after you finished your configuration.