The Area Options offer configurations to adjust the layout of your component area and its legend.
Area Options / Legend Options
The Area Options are labeled differently for some components in the charts and tables section.
For a OLAP Table, these options are called Table Area Options, for any charts these options are called Diagram Area & Legend Options.
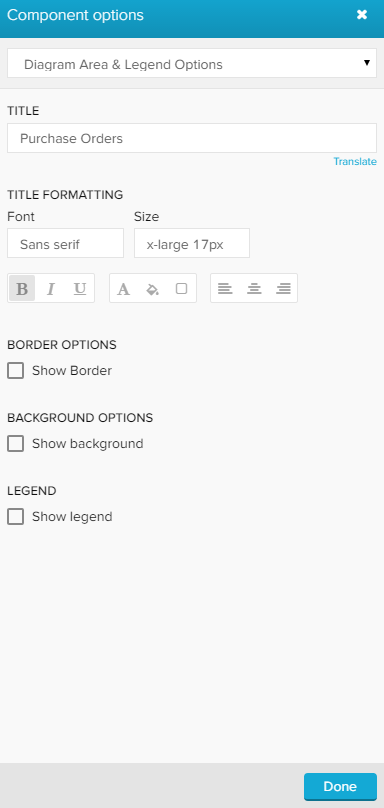
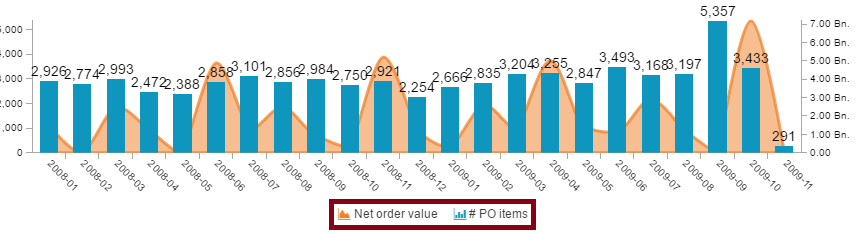
This is a screenshot from the Area Options of a chart.
The following options are available:
Type your desired title into the text field.
When a title is set, its formatting option will be shown. Font, size, color and alignment can be defined.

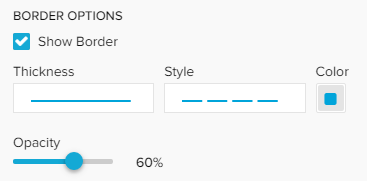
Activate the Show Border checkbox to surround your chart with a border.
You can specify the thickness, style, color and opacity of the borderline.
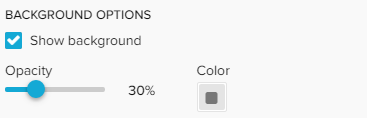
Set a background color for your chart!
Activate the Show background checkbox, select a color and adjust the opacity.
Activate the Show legend option to display a legend in your chart area.
By default, the legend will show up below your chart.
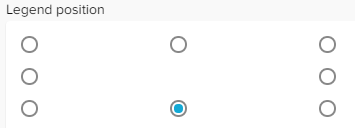
You can however change the legend's position in the Legend position section:
If the addition of the legend escapes the available space for your chart in the analysis sheet, you can use the Overlay legend option.
Instead of decreasing the chart's size, the legend will now overlapp the axis or the chart area itself to fit its assigned position.
Please Note
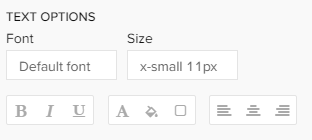
To format your legend, Legend Formatting offers you several options:
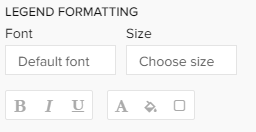
You can alter the default font, size, highlighting, color, background color and the border color.
OLAP Table only
This section is only available for OLAP Tables.
You can define a format for your table content, using the following formatting options:
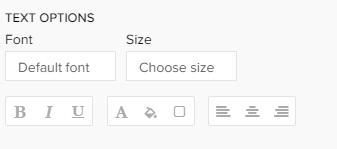
You can set a font, a text size, change the color, border, background, set a text alignment and text highlighting.
Don't forget to save your settings with  .
.