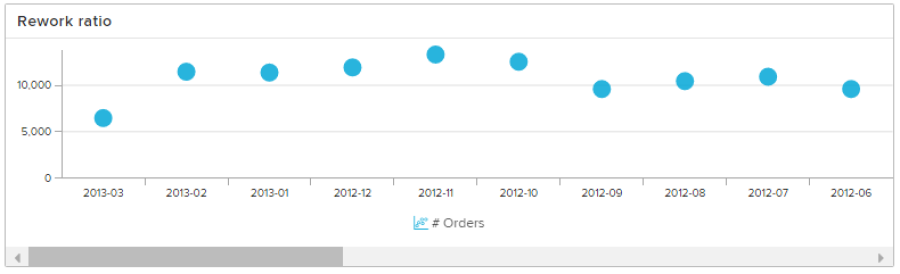
A Scatter plot is another variation of a Line Chart. Instead of a line, the values are therefore displayed as circles.
For analyzing correlations between attributes, this is the component to choose! It allows you to choose one or two dimensions and one aggregation whose relationship will be displayed.
Configuration
The following configuration tabs are available in the component settings: