Line Charts connect points illustrating the trend of your selected data over a specified dimension (e.g. time).
This is a great way to illustrate your data flow over time.
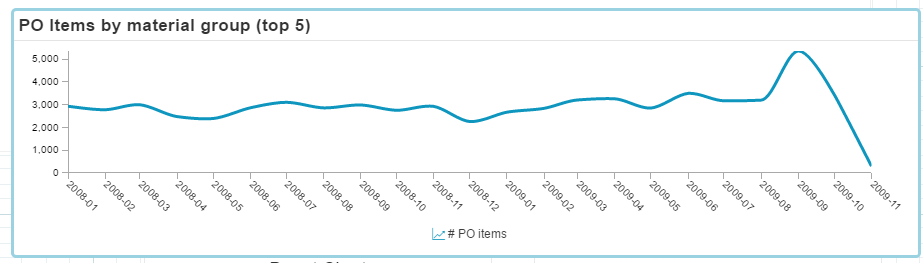
Chart Type
It is very easy to convert charts (for example Column Charts) to a Line Chart diagramm!
Open the General Options of your "old" chart, and choose "Line Chart" at the Component type dropdown.
Configuration
In the Settings, you will recognize the following Configuration Options: