The Visual Editor offers a graphical user interface to "build" dimensions and KPIs utilizing visual block representations of PQL statements.
The first step after the creation of a custom dimension or custim KPI is to choose a category. This will create a template in the main area with recommended connections.
The following categories are available:
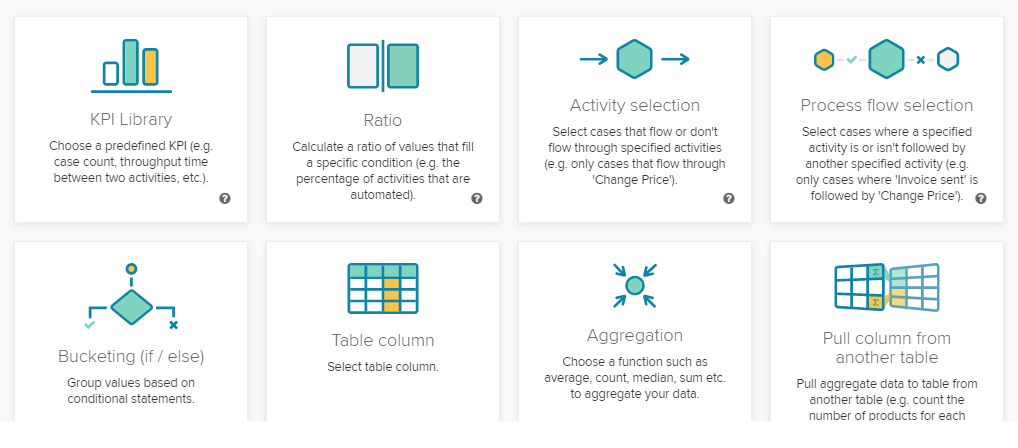
Let's focus on the main area and the toolbar.
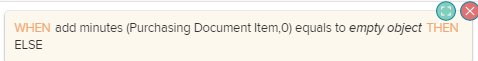
The main area offers a pre-defined template, according to your category selection.
This template allows you to create your dimension/KPI, using drop-down menus.
They offer either functionalities or columns.
If you have already selected a column or a table, the menu will offer the following possibilities:
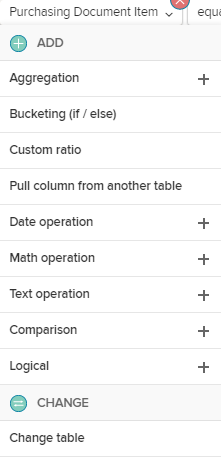
With Change, you can choose another table or column.
With the functions listed at the Add section, you can apply operations to your column.
This usually leads to the addition of brackets, to specify the new operation.
Please note, that the category templates are meant to support you.
However, you can of course edit or rearrange each of them to support your requirements.
If you are editing a section inside brackets, you can click into the section to furthermore work with the following two icons, that will appear at the upper right corner of your current section:
![]() : This will collapse the current section inside brackets.
: This will collapse the current section inside brackets.
To re-edit this section, use the ![]() icon.
icon.
![]() : This will permanently remove this section. Included sections will be deleted as well, parent sections won't be afected. The hierarchy will be adopted.
: This will permanently remove this section. Included sections will be deleted as well, parent sections won't be afected. The hierarchy will be adopted.
You can at any time switch to/from the Code Editor using these buttons:
Any changes that are made in the Code editor or in the Visual editor will be adopted.