The overview section was designed to provide the most important information about your process conformance at a first glance!
All cases, that are selected through any active Selections will be compared to your Process Model.
Overview
The Overview section includes 4 KPIs and a chart, that displays the relative amount of conformance over a past period of time.
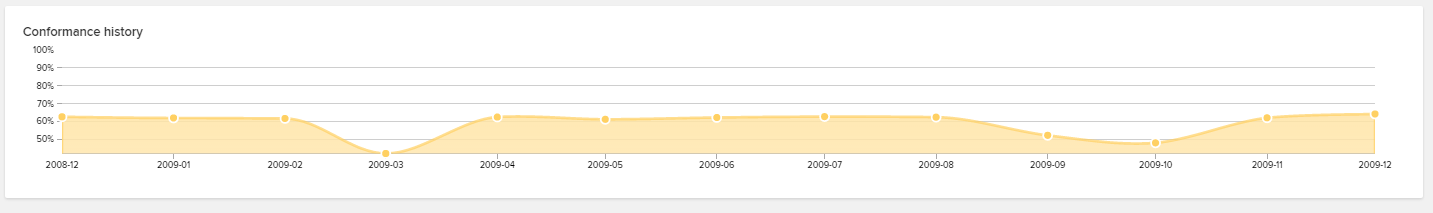
Conformance history
The conformance history is a chart that displays the course of the relative conformance.
Effects on KPIs
All KPIs in this section are comparisons of cases, that conform to your Process Model with those, that do not conform.
Conforming cases are colored green, non-conforming cases are colored red.
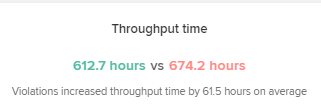
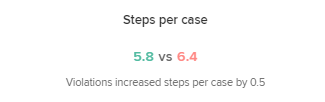
For each KPI, a "Violations increased..." statement is added. This helps you to identify the effect of cases, that violate your process model.
By default, there are two KPIs visible:
This KPI compares the throughput time:
This KPI compares the events per case:
You can add custom KPIs in the PI Conformance tool, too!
Violations
This section lists all violations, sorted to their affection on cases.
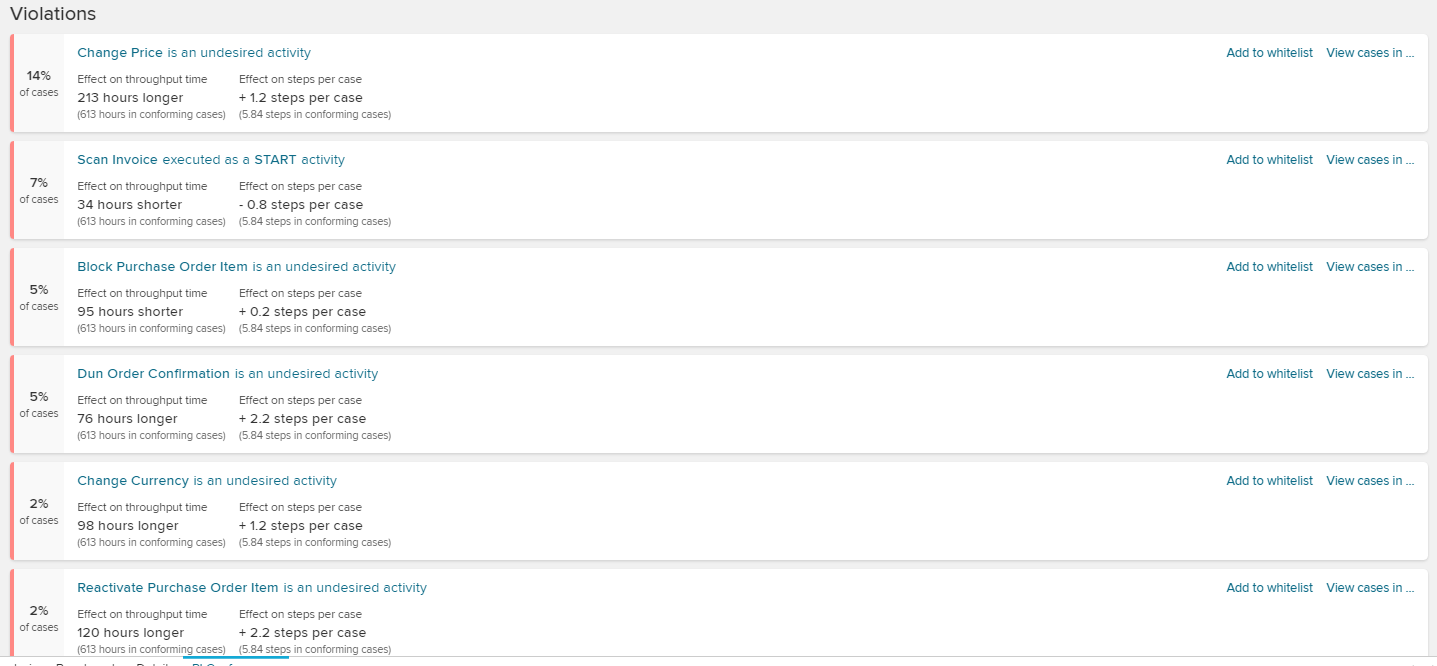
Let's have a closer look on this view:
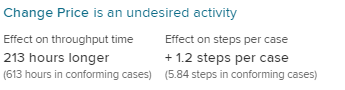
Each valuation starts with listing the actual violation (for example: "Change Price is an undesired activity").
Furthermore, the effects on your KPIs (see above) are displayed, with the direct derivation which is caused by this violation.
Each case offers two options: 
You can either add this violation to your Whitelist, or further examine your case with the "View cases in..." link.
This will open the following drop-down menu, which lists all sheets that are included in this analysis document.
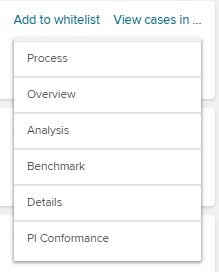
Therefore, a Selection is created, that includes all cases of this violation.
For further examination of your violation, just click on the valuation to open a detailed view on your violation:
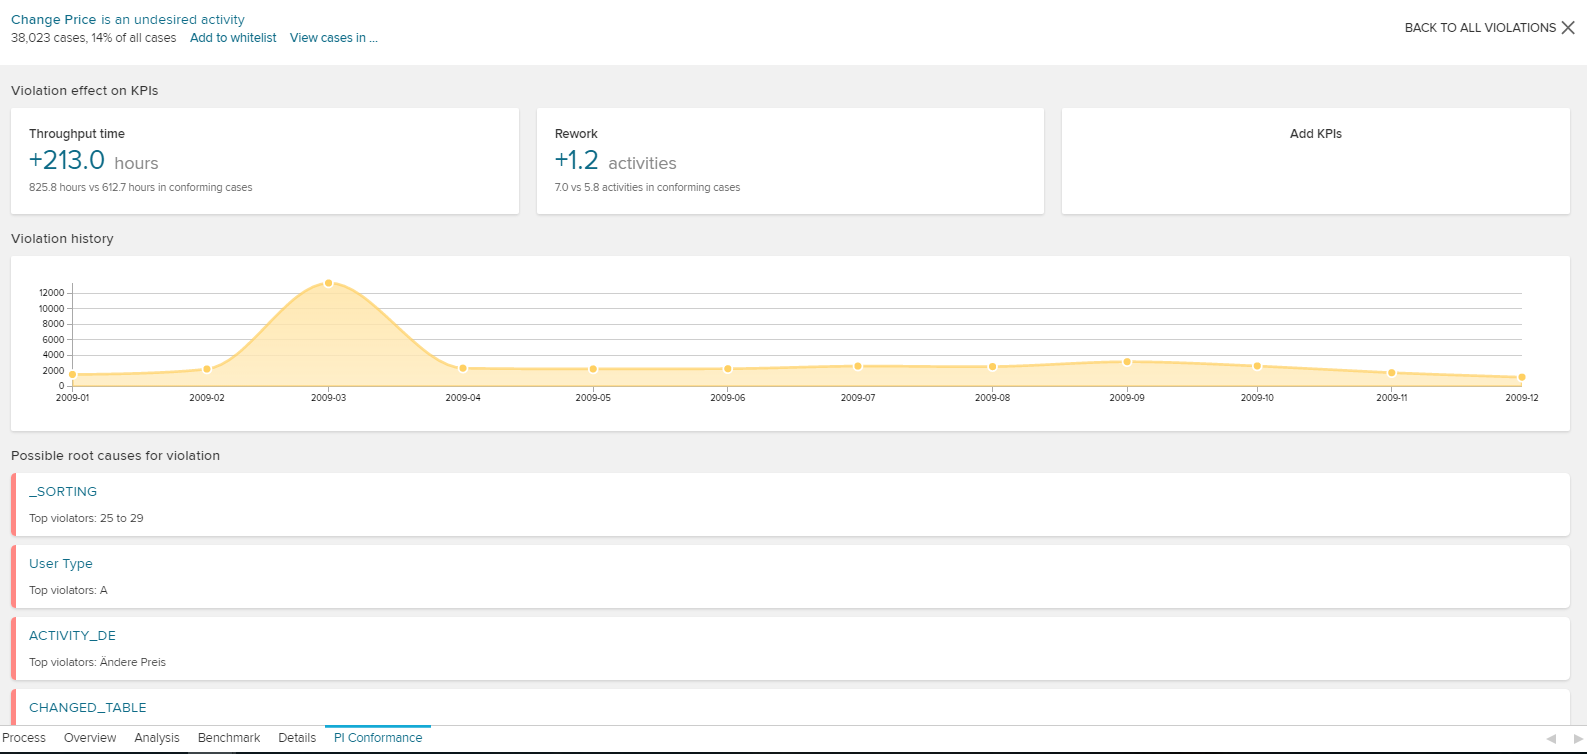
This view not only lists the KPIs and the violation history (in the same format as the above described conformance history), but also includes a list of all available activities and their prevelance of all cases to this valuation.