eThe following options are available for the Diagram Area:
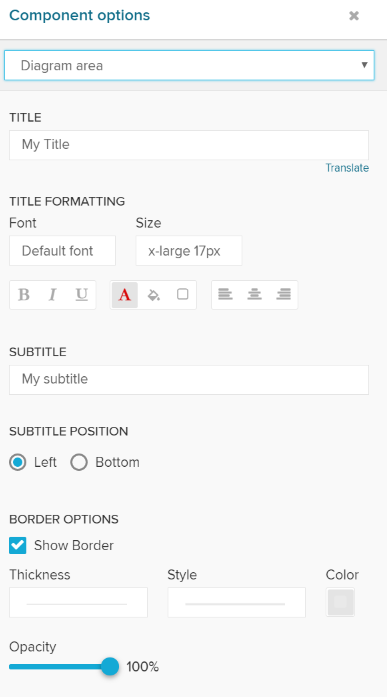
The title will appear above the Single KPI area in your analysis sheet.
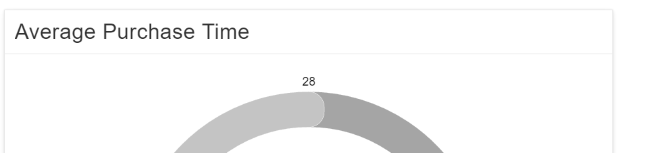
Please specify your desired title into the text field.

Next to the text field, a small pencil icon ( ) appears.
This will open the following formatting options:
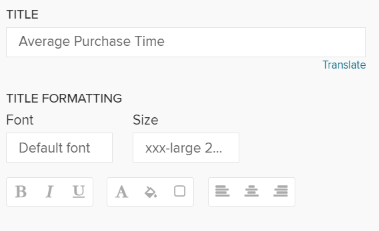
You may edit your font, its size ,text highlighting, colors (font-, background - and border color) and your text orientation.
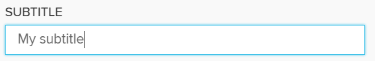
To show a Subtitle under your component, you can use this text field:
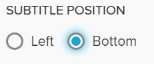
The subtitle position can only be altered when you choose the type "Number".
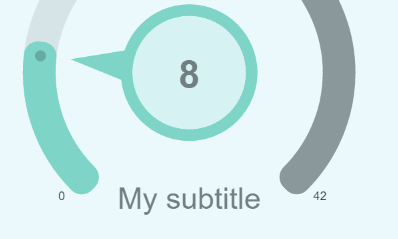
You can place your subtitle either below or left to your (number) KPI aggregation:
 (left)
 (bottom)
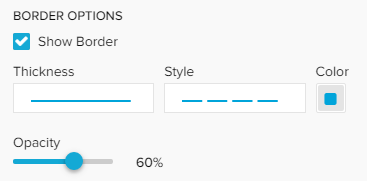
Activate the Show Border checkbox to surround your Single KPI with a border.
You can specify the thickness, style, color and opacity of the borderline.