The variant explorer allows the user to explore his process based on end to end variants.
Variant
A variant is a process flow consisting of different activities.
Each case is associated with a variant, describing the "path" of this case.
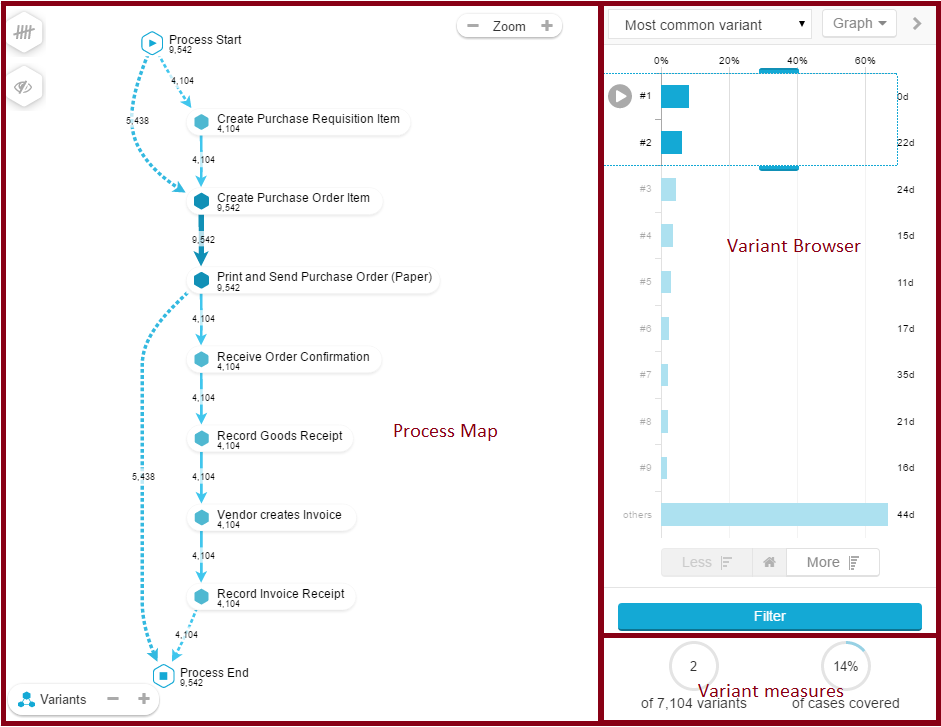
As you can see in the screenshot, the variant explorer is made of three parts.
The Process Map is a process explorer. You can apply your KPIs and make use of the inline activity chooser.
This process graph is affected by the variants that are selected in the Variant Browser.
The Variant Browser displays variants according to your selections (see below). By default, 9 variants are displayed.
All variants that are not displayed are combined and displayed as "others":
The Variant measures show quantitive measures, based on your current variant selection from the variant browser.
Based on the variants, you can apply a selection. As soon as you change the selected variants (drag&drop your mouse to change the selected variants), the process map will display all selected variants.
Let's take a closer look at the variant browser:
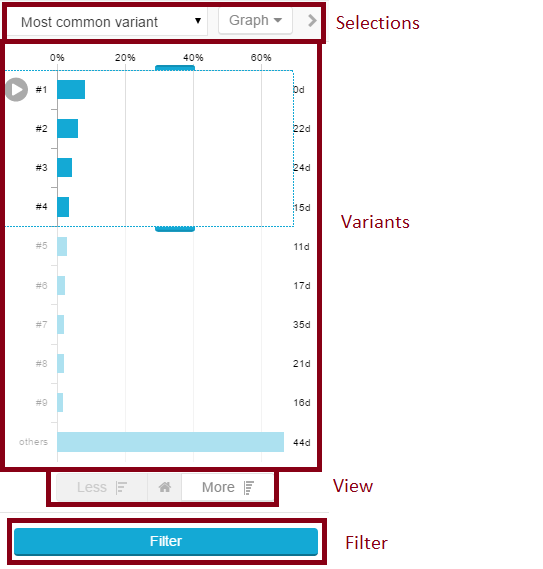
In the Selections section you can select the variants to be displayed. The following options are available:
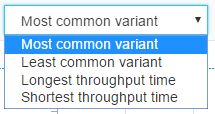
Furthermore, you can change the view of your variant browser, using the second drop-down menu:
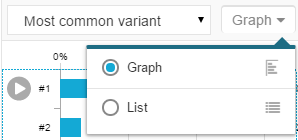
By default, "Graph" is selected. This will display your variants as a vertical column chart.
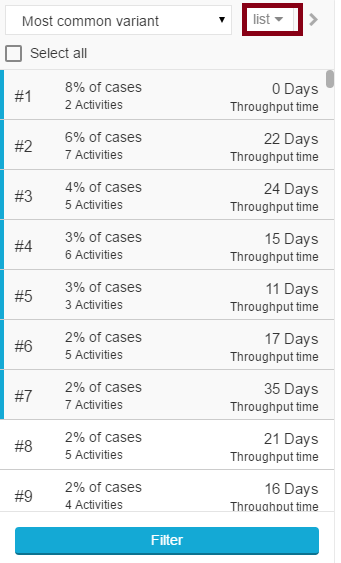
Choose List, to see your selected variants in a list: