The Case Explorer is an intuitive tool for examining cases and their respective activities. The data provided will be presented in tables as well as in a process model displaying the single activities of a case.
The data displayed in the Case Explorer partly depends on its configuration, which will be explained in The Case Explorer (Analysis View). However, Figure 2.10 shows an exemplary usage of the Case Explorer and its components – the Cases Table, the Activities Table and the Process Model – which will be further explained in the following sections.
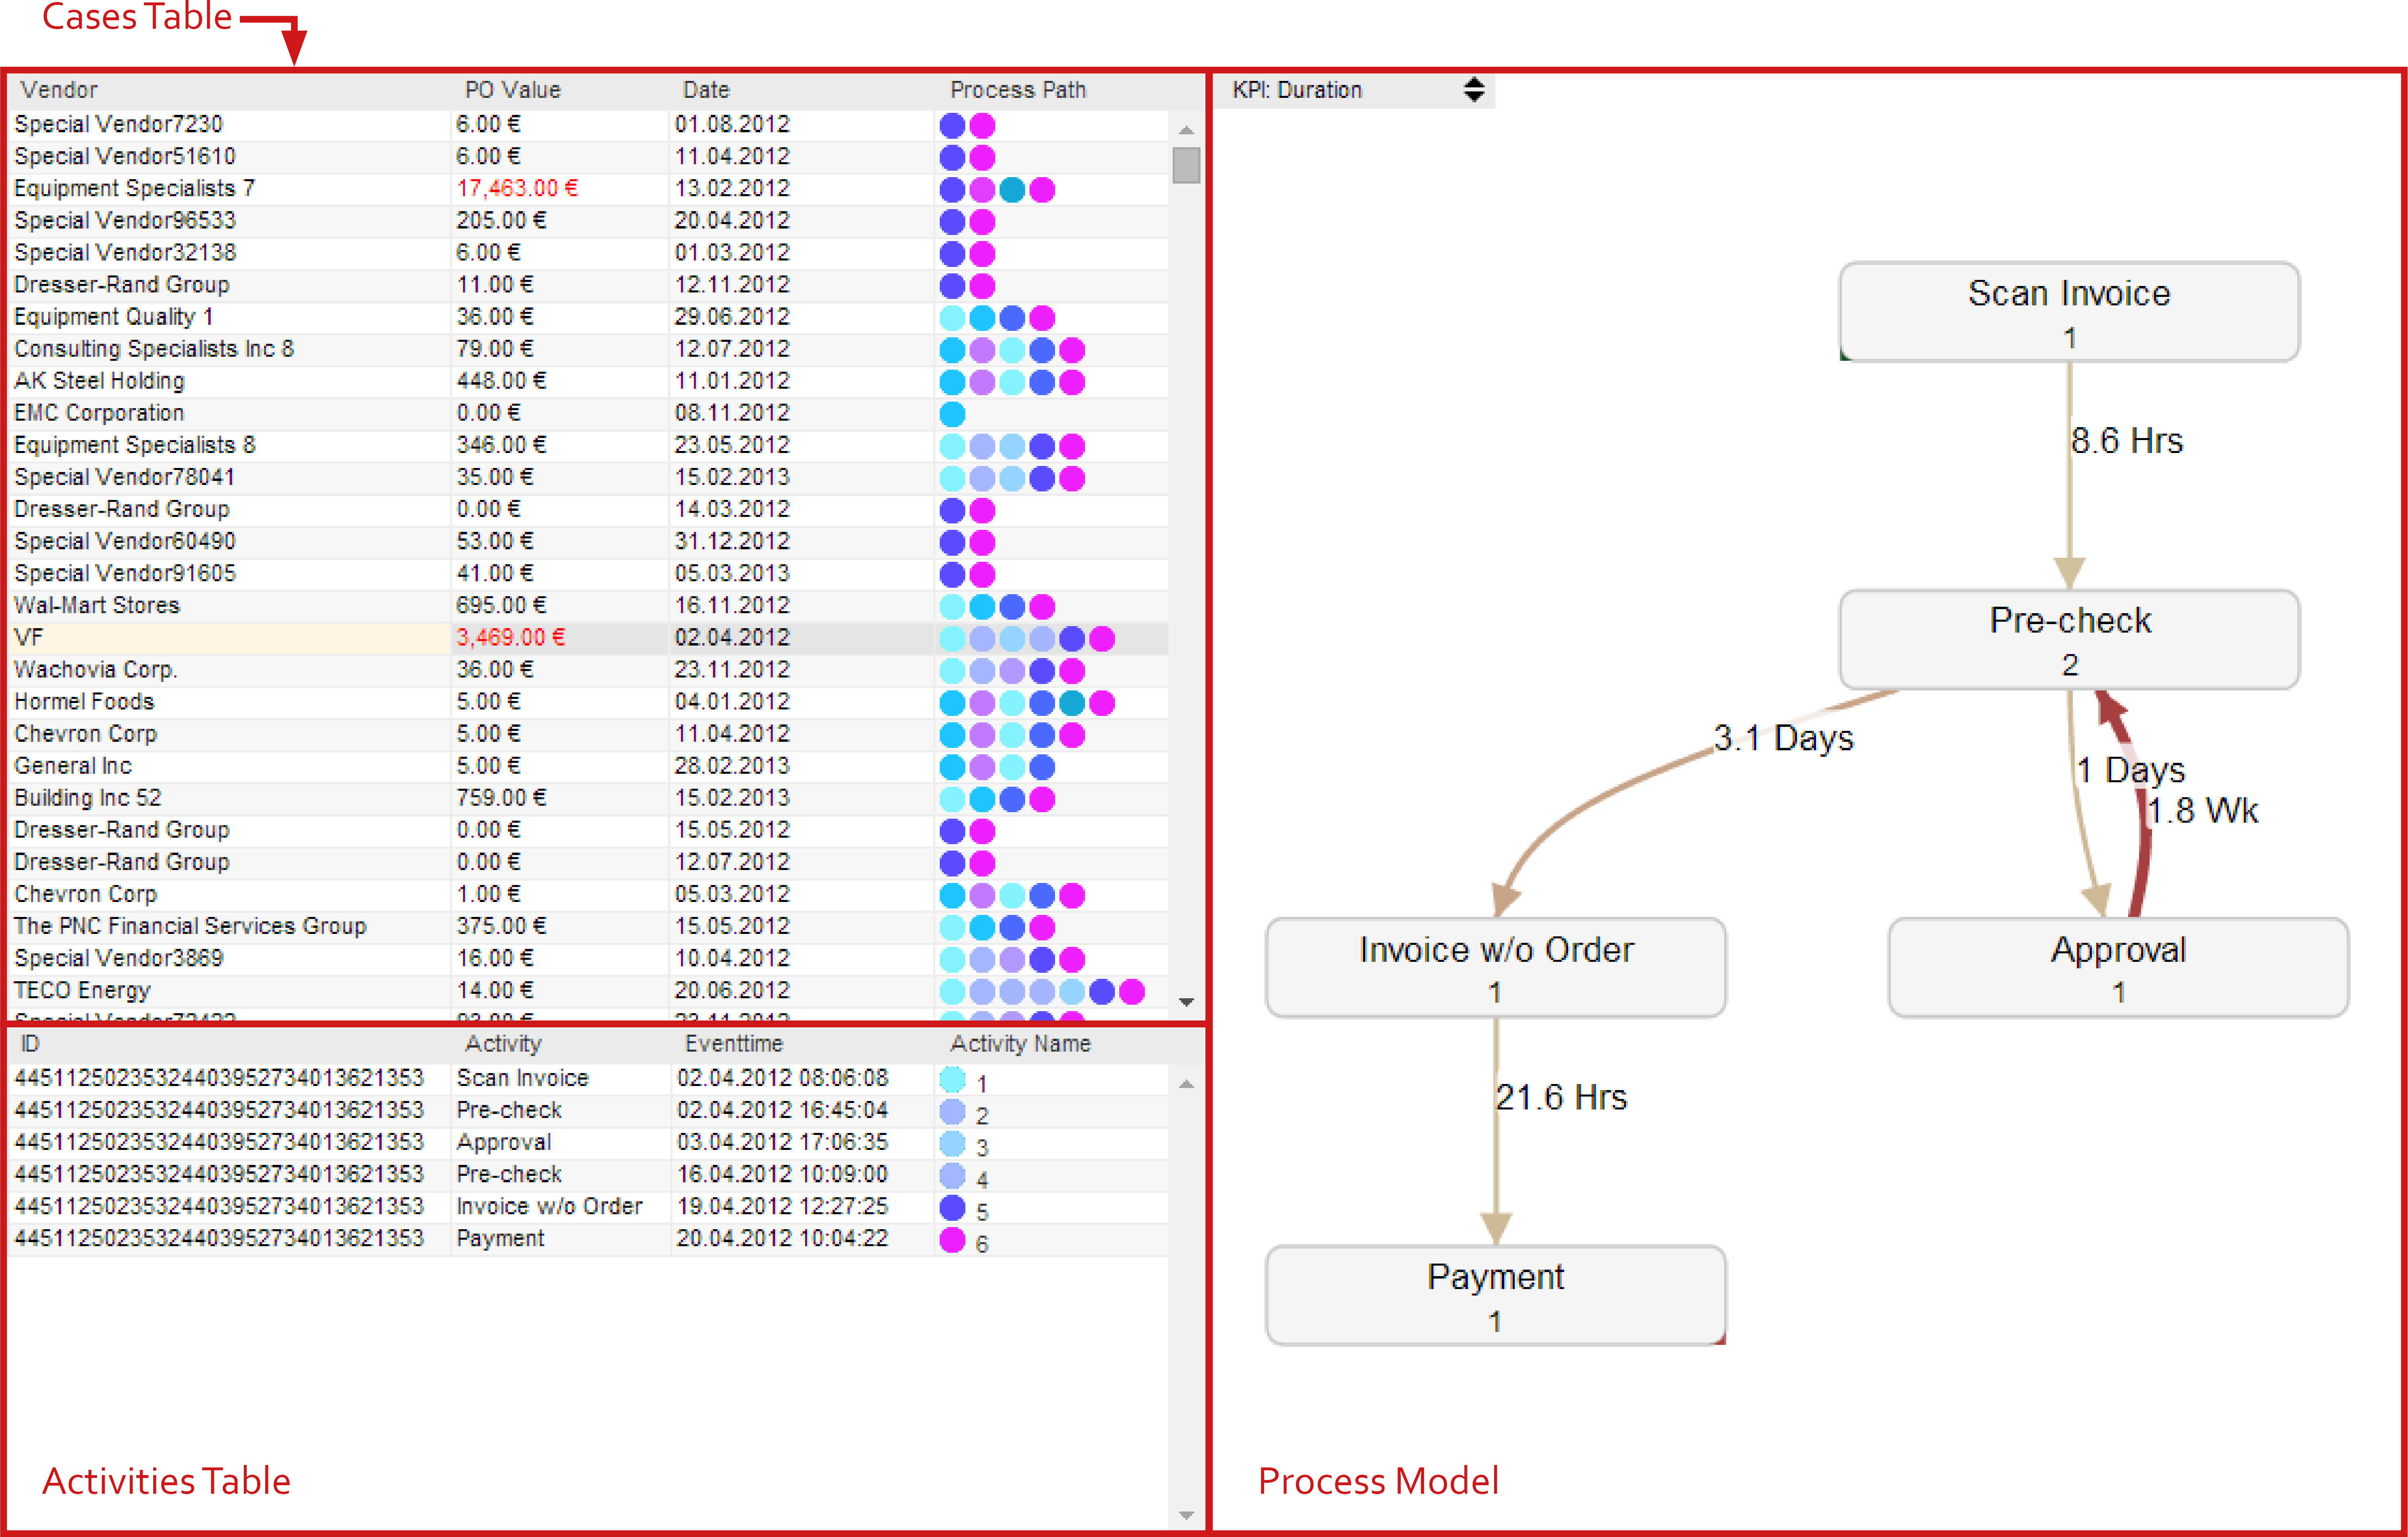
Figue 2.10: Case Explorer - Overview
The Cases Table
The cases table is the starting point for any case exploration. Here, all available cases are listed together with further information belonging to the case. The columns shown in the Case Explorer depend on its respective configuration.
Ordering and Selection of Cases
Selecting a case is fairly simple. Just click on the case that raised your interest and further information about it will be given in the activities table and process model which will be explained in the following sections.
In order to quickly find interesting cases, any columns provided in the Case Explorer can be used for arranging the data either in ascending or descending order. If you hover your mouse over the column heads, small arrows pointing up or down will appear. Click on one of them to choose your desired order for the data.
The Process Path Column
Depending on the configuration of the Case Explorer, the Process Path Column that can be seen on the right of the cases table in Figure 2.10 will be shown. The Process Path Column provides a visual representation of the process path by assigning a color to each activity and displaying the path as sequence of differently colored dots. That way, cases that consist of the same sequence of activities can be easily identified.
The Activities Table
Once you have chosen a case from the cases table, the activity table provides a drill down into the single activities of the case. By default, information about the activity name, ID and Eventtime will be given. But again the information provided depends on the configuration of the Case Explorer.
The Process Model
Once you have selected a case, the process model will display the sequence of activities also given in the activity table. Thus, in contrast to the Process Explorer, the process model here will only show the path of one single case.
Just like in the Process Explorer, you can also switch between different process KPIs. You will find the same box in the top left corner of the process model section, giving you information about the current process KPI applied and the possibility to switch between KPIs by using the arrows pointing up and down. In Figure 2.13 you can see, that the process KPI “Duration” has been applied to the model. That way, the edges of the process model will now show the time it took for transitions between activities rather than the number of cases passing through the model.