SAP Process Mining by Celonis comes with a wide variety of different charts and tables you can use for presenting your data. The following sections will give an overview over all charts and tables available and over how you can interact with them in View-Mode. Configuration of charts and tables will be explained in Charts and Tables (Analysis View).
General Information on Filtering with Charts and Tables
As a general information it is very important to know that the data provided in any chart or table that can be created with SAP Process Mining by Celonis can be used for filtering. Selecting data for filtering within a chart or table will make all the other analysis components, such as other charts and tables or process models, on the user interface adapt to the new data basis. This makes filtering a very powerful instrument that can be used for exact drill-downs and cause analyses.
The exact details about how to use a chart or table for filtering will be given for each component individually in the following sections.
The OLAP Table
Information given in an OLAP Table
OLAP Tables are probably the simplest component of SAP Process Mining by Celonis . An Example can be seen in Figure 2.11. OLAP tables consist of an indefinite number of columns that are either dimensions or aggregations. Dimensions are simple columns that influence the level of aggregation. In Figure 2.11 the first two columns “Vendor” and “Document Number” are dimensions whereas the last one “Amount” is an aggregation. The data shown in the column “Amount” depends on the data given in the dimension columns. Each amount (meaning the amount of cases) is given for a combination of vendor and document number. Besides simple counts, aggregations can also be done in the form of sums, averages, minimums or maximums.
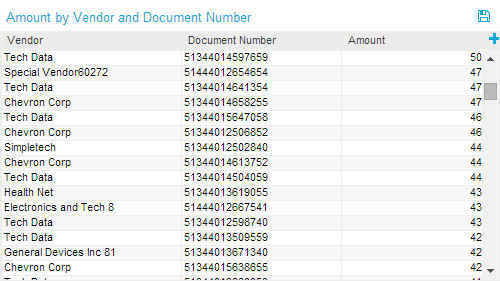
Figure 2.11: The OLA table
Interaction with the OLAP Table
Like every chart or table in SAP Process Mining by Celonis , the OLAP Table allows for a certain amount of interaction. First of all, the data provided can be used for filtering by selecting one or more rows and clicking on the small ![]() -button appearing on the top of the table. As always, effects of filters can be reverted by the “Revert Selection” option appearing on top of the component after filters have been applied. When filtering on rows of an OLAP Table, the system will take all data given in the dimension columns of a row and combine them via an AND connection. This means, if we want to filter on the first row shown in Figure 2.11, the system will filter on “Vendor = Tech Data AND Document Number = 51344014597659”. If you filter on several rows, single rows will be combined via an OR connection.
-button appearing on the top of the table. As always, effects of filters can be reverted by the “Revert Selection” option appearing on top of the component after filters have been applied. When filtering on rows of an OLAP Table, the system will take all data given in the dimension columns of a row and combine them via an AND connection. This means, if we want to filter on the first row shown in Figure 2.11, the system will filter on “Vendor = Tech Data AND Document Number = 51344014597659”. If you filter on several rows, single rows will be combined via an OR connection.
Moreover, data contained in columns can be arranged in either ascending or descending order by hovering over the head of the table and clicking on one of the small arrows pointing up or down. This can be done with dimension columns as well as with aggregation columns.
For dimension columns, there is also a search function available. While hovering over the table head, a small magnifying glass icon will appear. After clicking on it, an input text field will appear and the column can be searched for whole expressions or only parts of expressions. After applying the filter, only rows containing the expression will remain. If you want to undo your filter, simply click on the magnifying glass once more or on the red dot appearing next to the column name and use the already known ![]() -button to revert the effects.
-button to revert the effects.
With OLAP Tables it is also possible to dynamically hide or show columns after the table has been configured. Simply click on the small plus icon on the right side of the table head (this can also be seen in Figure 2.11, choose the columns you want to show in the table and apply your changes. Changes can be reverted in the same fashion. Please note that hiding columns will also influence the aggregations selected. The system will look upon a hidden column just as if it was not integrated into the table at all and therefore will not consider it for aggregations anymore. The same will happen when filtering. If you hide a column from a table, the column will not be considered in the AND connection done by the system (as explained in the previous section about filtering).
If export is allowed during configuration, data provided in an OLAP Table can also be exported into Microsoft Excel. If export was allowed, a small disk icon (![]() ) will appear on top of the table. Clicking on it will lead to a download of the tables content as an xlsx file.
) will appear on top of the table. Clicking on it will lead to a download of the tables content as an xlsx file.