The process explorer component allows you to insert the process explorer into your analysis sheets. In the settings, you can specify general options, grouping and coloring of the activity nodes.
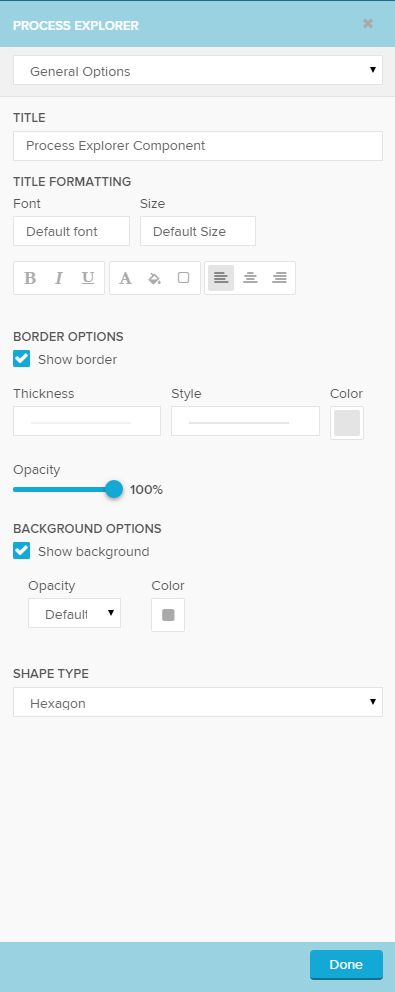
General Options
- Title: In the first section a title can be added to the component by typing your desired title into the textfield. When a title is set, its formating option will be shown directly as the next settings and font, size, color and alignment can be defined.
- Border: With a checkbox a border for the component can be applied. Afterwards the border thickness, style, color and opacity can be adjusted.
- Background: With a checkbox a background for the component can be applied. The color and opacity can be adjusted in the appearing settings.
- Shape type: You can choose between hexagon, circle and square representations of your activity nodes.
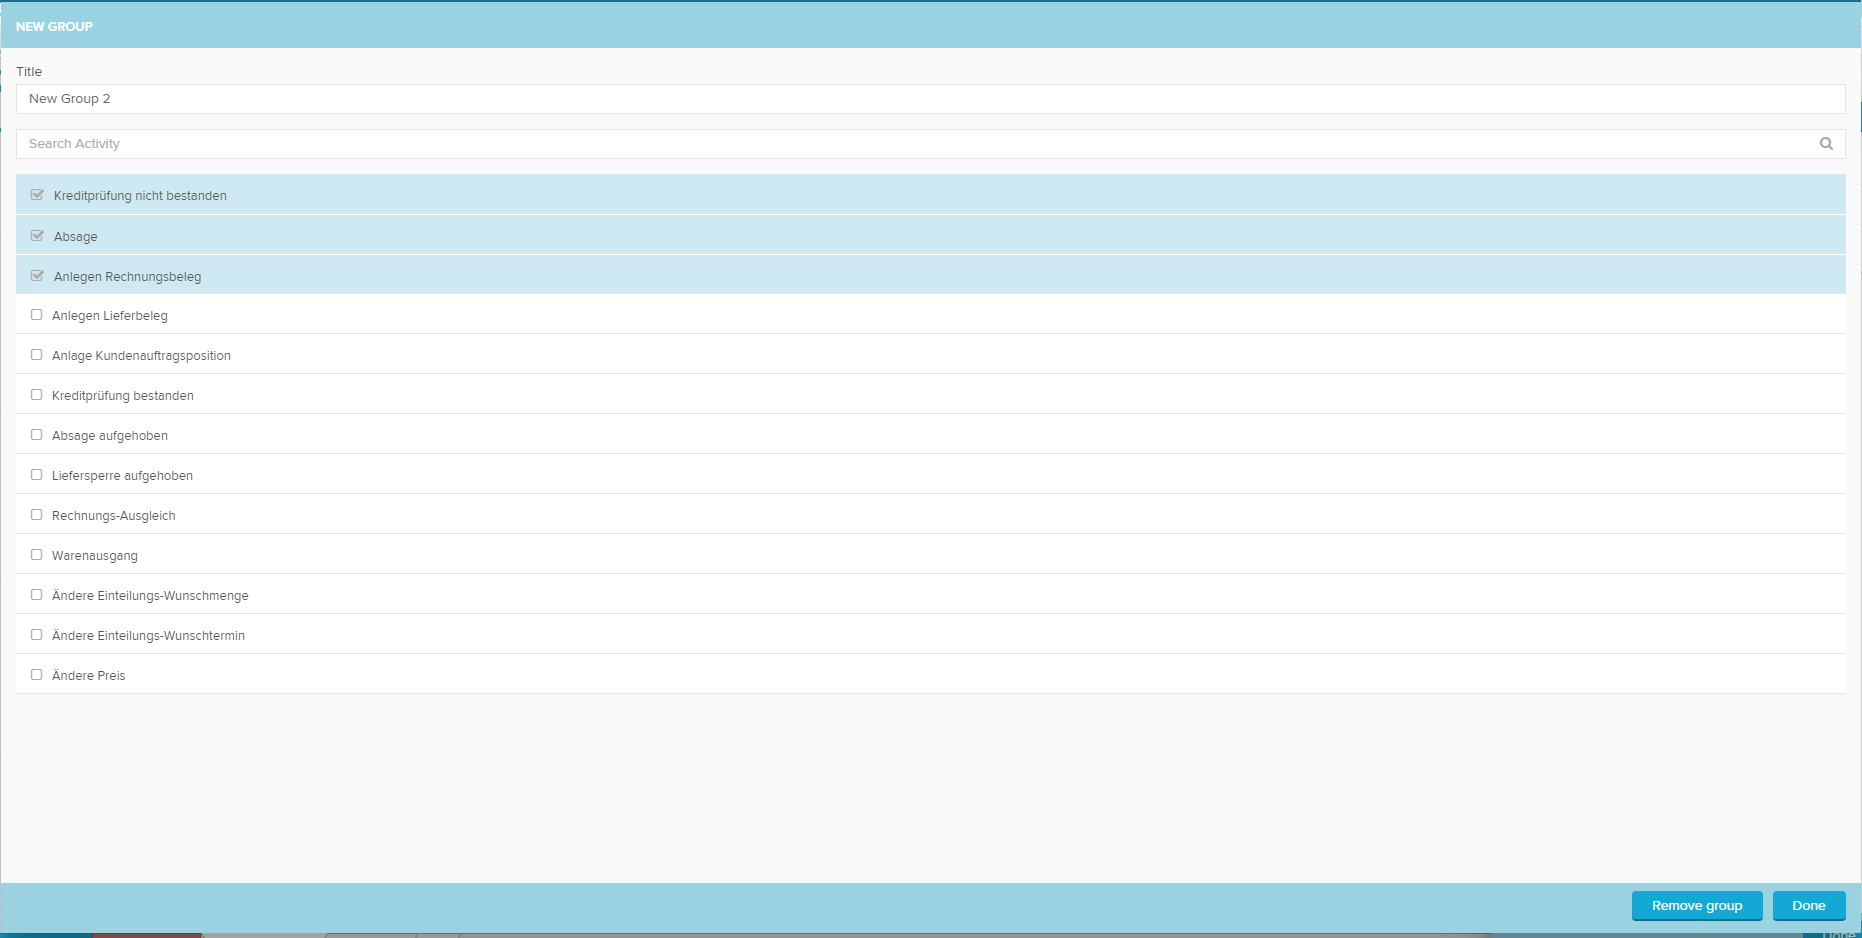
Activity Grouping
Here the activities can be grouped. Click  to create a new group or on one of the groups in the list to edit them. In the group's options you can specify which activtiy will be included or delete an existing group with
  .
.
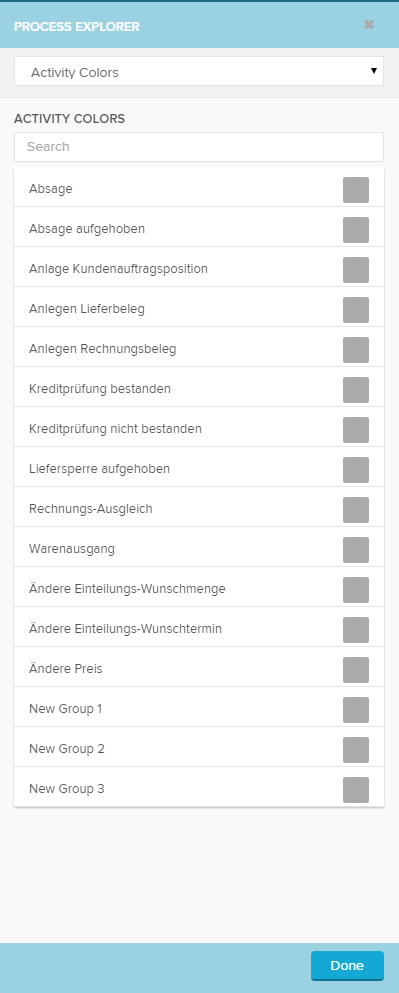
Activity Colors
Here every activity or group can be given an own color. To do so click on the color-picker next to the activities: 
Custom KPI Views
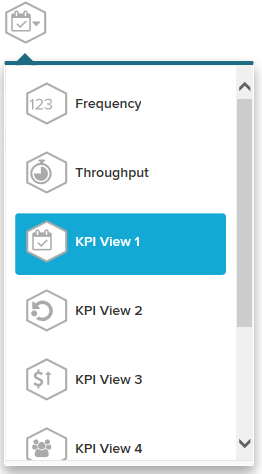
Custom KPI Views allow the analyst to create additional KPIs that can be displayed in the Process Explorer. Choose the KPI views in the same place where you switch between the frequency Process Explorer and the Throughput Time Explorer: 
To add a custom KPI, enter the analysis  on the top right of the analysis view:
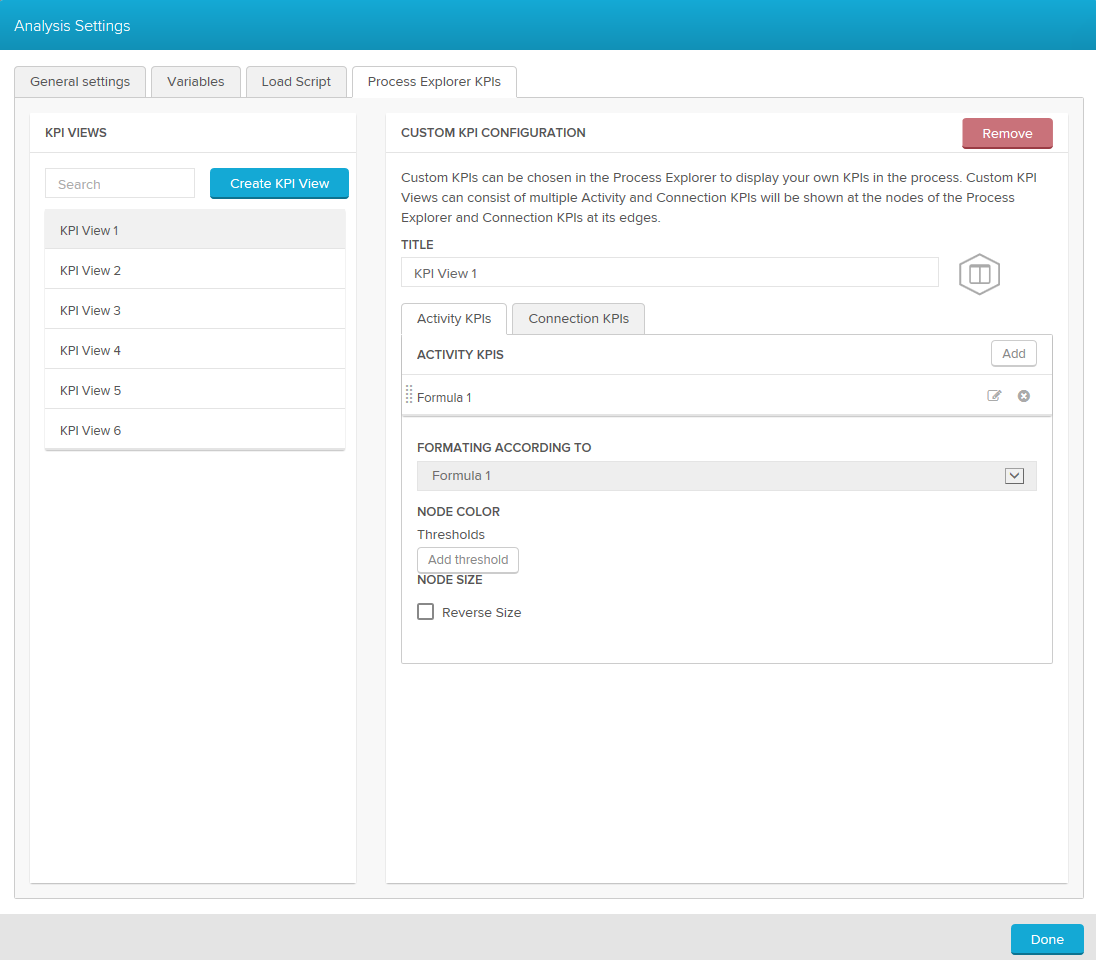
In a KPI view the analyst can define Activity KPIs and Edge KPIs. Add a new KPI view with:  . Both activity and connection KPIs can be added with the add button. When you add a new KPI or edit it by clicking on the Custom KPI Editor will open:
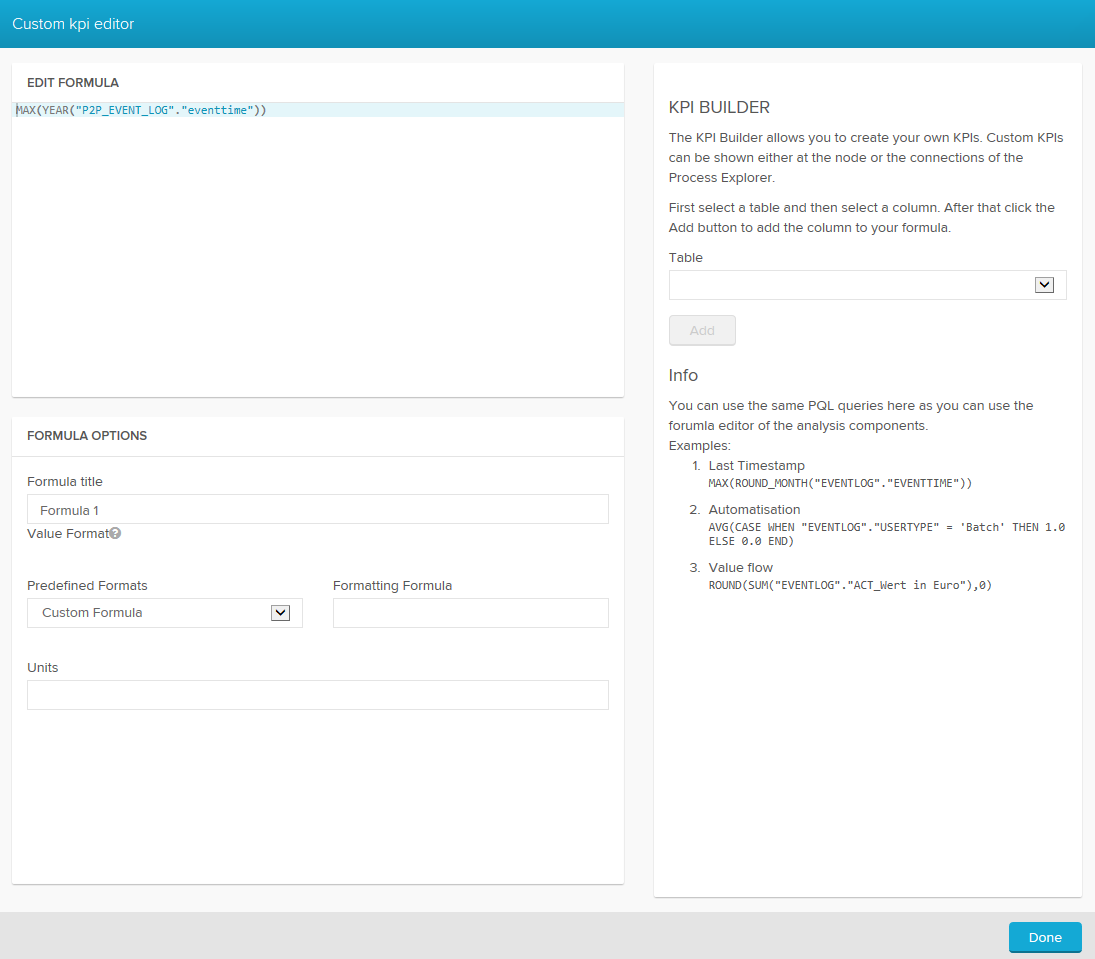
On the bottom left the formula title and format option can be found. On the right the KPI Builder helps the analyst to quickly add columns from your dataset.
It is possible to add multiple KPIs to the KPI view. These KPIs will be separated by "|" when they are displayed in the process graph: 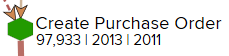
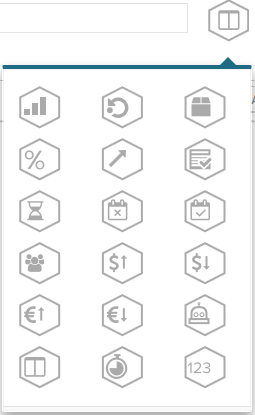
You can choose between different icons that will be displayed in the Process Explorer afterwards:
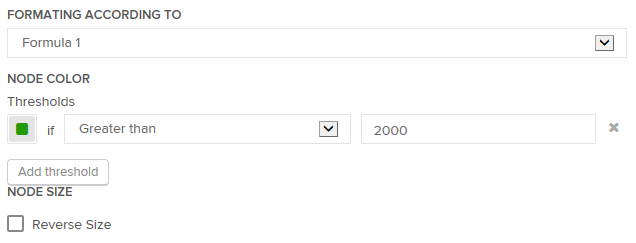
The process nodes and connections can be formated according to the custom KPIs. The analyst can define thresholds for the colors based on a formula in the custom KPIs:
Usefull activity KPIs could be:
| Name | Example |
|---|---|
| Last Timestamp | MAX(ROUND_MONTH("EVENTLOG"."EVENTTIME")) |
| Automatisation | AVG(CASE WHEN "EVENTLOG"."USERTYPE"='Batch' THEN 1.0 ELSE 0.0 END) |
| Value flow | ROUND(SUM("EVENTLOG"."ACT_Wert"),0) |
Usefull connection KPIs could be:
| Name | Example |
|---|---|
| Duration | AVG(1.0*DATEDIFF(dd, SOURCE("EVENTLOG"."EVENTTIME"), TARGET("EVENTLOG"."EVENTTIME"))) |
| Automatisation | AVG(CASE WHEN TARGET("EVENTLOG"."USERTYPE")='Batch' THEN 1.0 ELSE 0.0 END) |
| Value flow | ROUND(SUM(TARGET("EVENTLOG"."ACT_Wert")),0) |
Connection KPIs
Columns have to be addressed as TARGET() or SOURCE() in connection KPIs. With these expressions, you define whether the value of the connection's target or source node will be used for the calculation.