Click on Process to access the Process Explorer. The Process Explorer is the core element of SAP Process Mining by Celonis 4, a powerful instrument making it possible to visualize and analyze processes.
In the following figure, you can see an exemplary display of the process explorer, showing all its different features which will be explained throughout the following sections.
The Process Explorer was designed to show processes in the most intuitive and flexible manner: as a process model. Different activities will be displayed as nodes, transitions between activities as edges.
Every node and edge will show the total number of cases passing through it and edges can also be configured to adapt their thickness according to that number (that is highly frequented edges will be thicker than less frequented ones).
Right-click on any activity node, to filter for Activities starting-/ending-/or passing through it, according to your parameters.
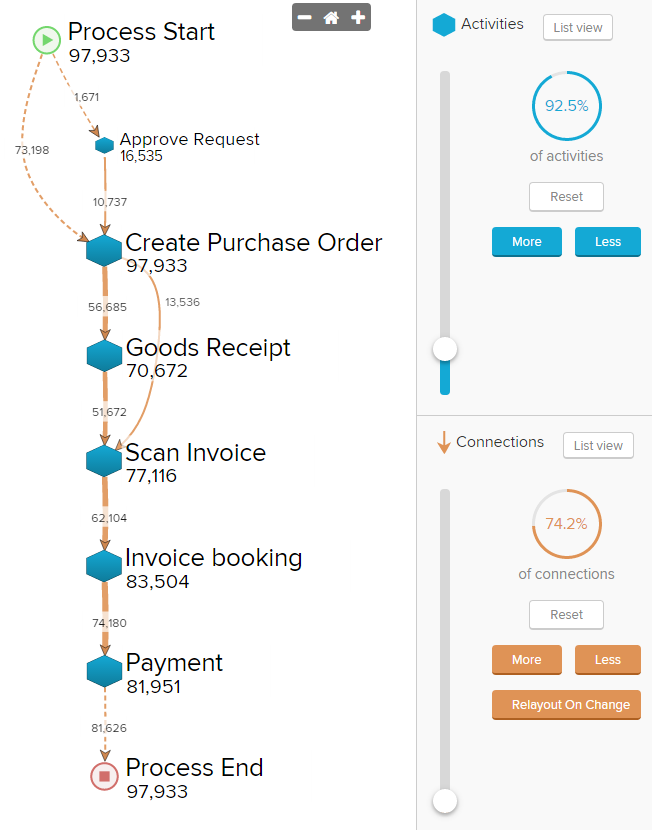
The covered data of the Process Explorer can be adjusted with the sliders and buttons on the right. The content is defined the following way:
- Baseline graph: The baseline graph shows the most frequent end-to-end variant, which meets the following conditions:
- The most frequent start node is the variant's start node.
- The most frequent end node is the variant's most frequent end node.
- The most frequent start node is not the same as the most frequent end node
- If no variant is found that fullfills the criterias above, the generally most frequent end-to-end variant is shown.
- Activity slider: By adding an activity with the acitivity slider, the next most frequent activity in the process appears. Additionally the connections of the most frequent subvariant that can connect the new activities to the existing graph are inserted.
- Connections slider: By adding a connection, the next most frequent connection between any of the visible activities will be inserted.
- Variant: A variant is a sequence of activities from process start to process end.
- Subvariant: A subvariant is a sequence of 4 activities that occur in the process.
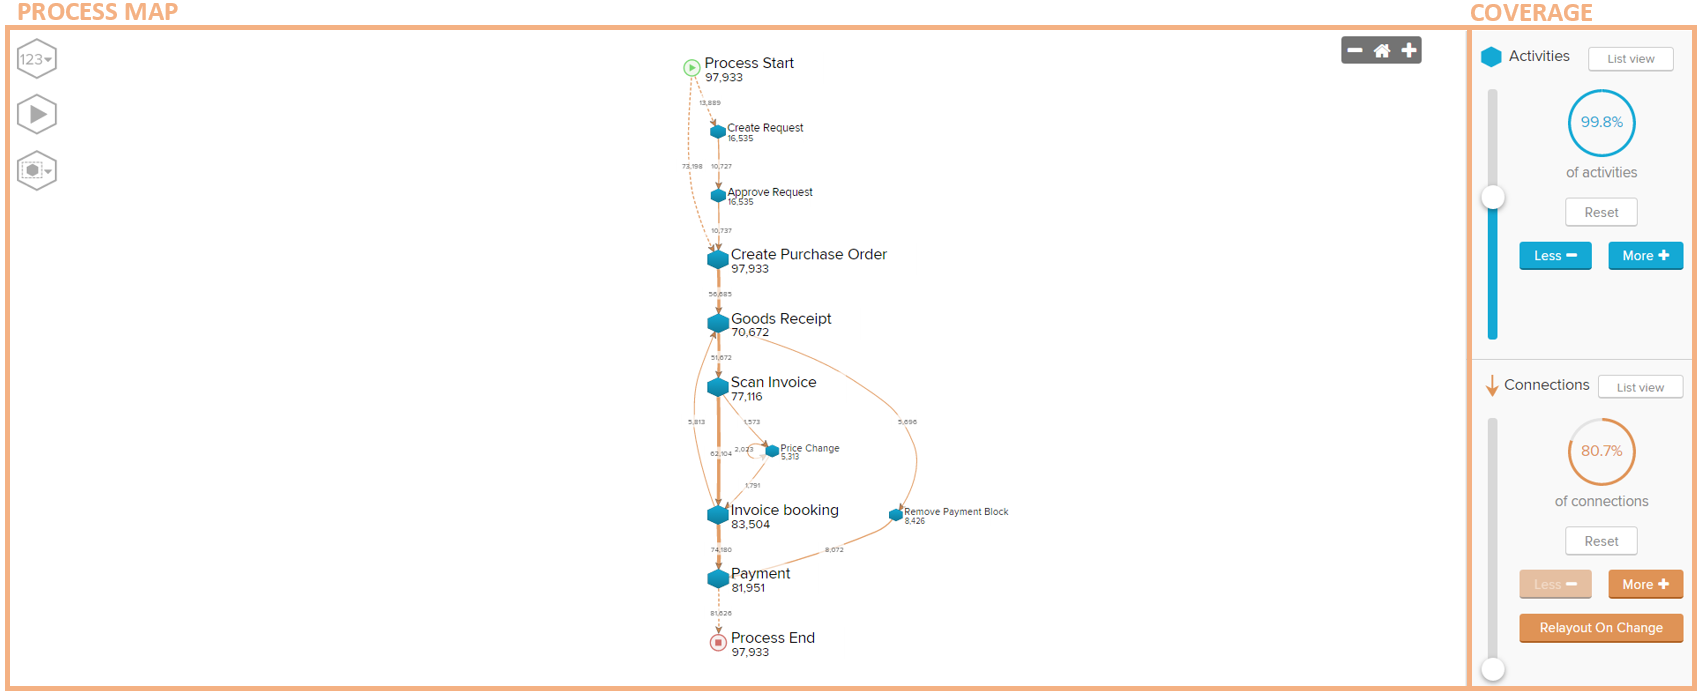
Coverage
At the right side of the Process Explorer you will find the coverage bars that allows you to change the coverage of the ACTIVITIES and the CONNECTIONS used within your process model.
At a very low coverage level, the process model will only show the most common process variants.
The higher the coverage, the more variants will be included into the process model.
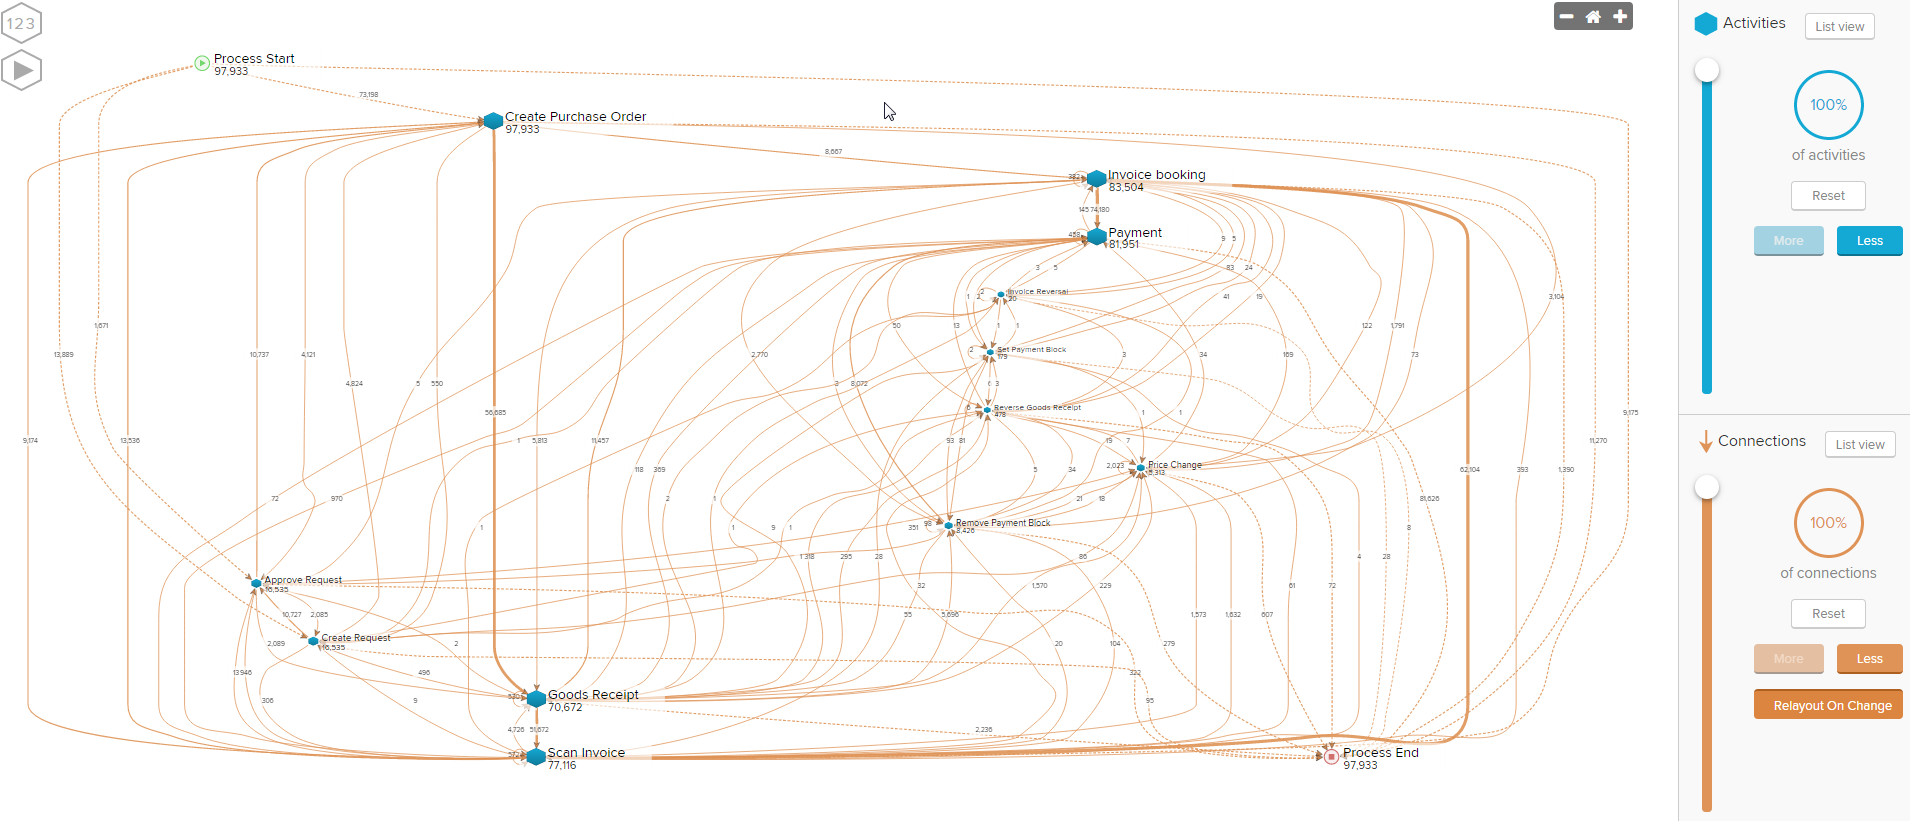
On the next screenshot a Process Model that consists of all activities and connections in this process is shown.
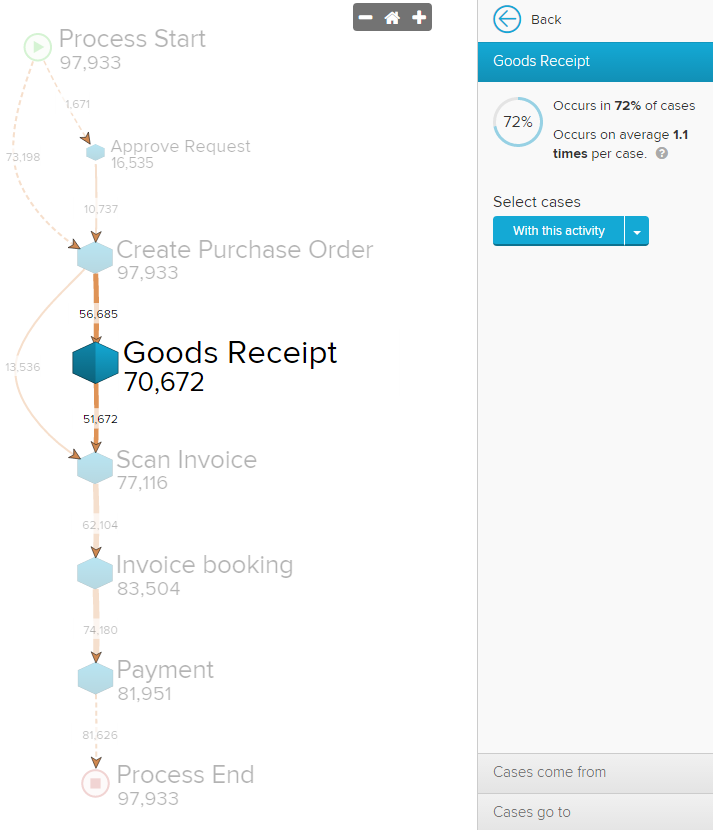
Activity Details
If you click on a node in the process model, you can get detailed information about an activity. After clicking, the following screen appears.
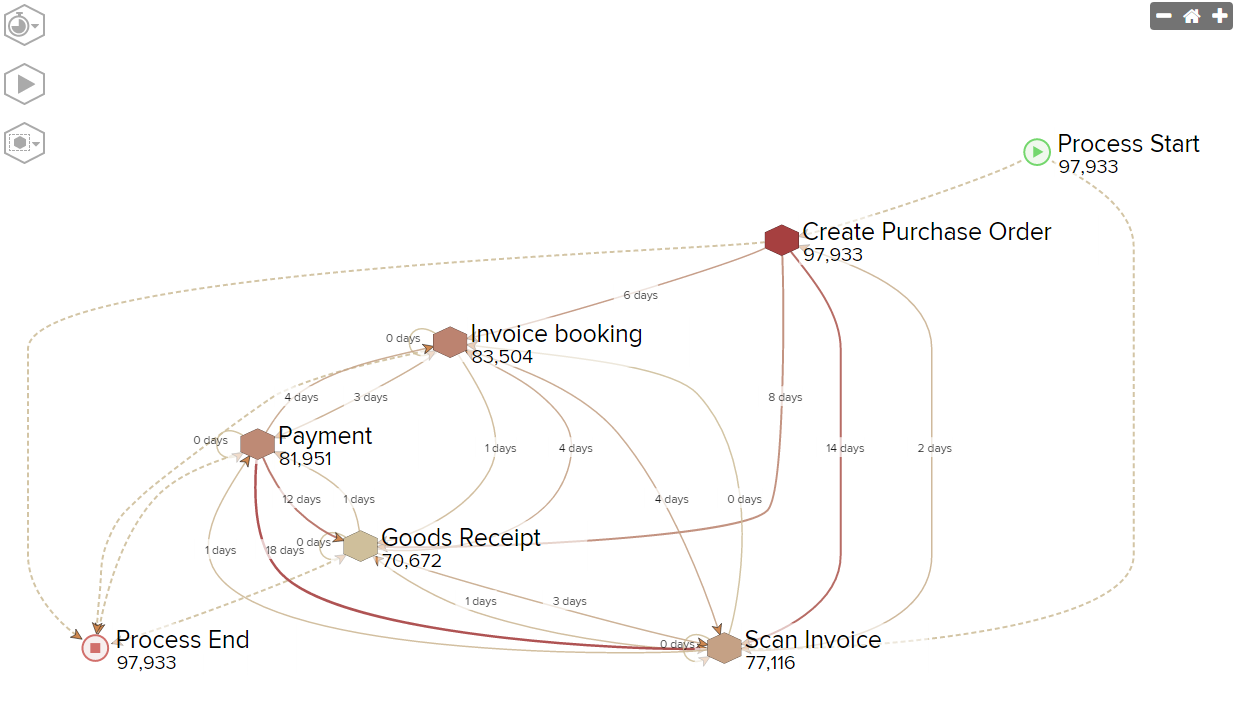
Throughput Time Explorer and Custom KPIs
It is also possible to show the throughput time between single activities in the Process Explorer. With the ![]() , it is possible to switch between the Frequency Process Explorer, Throughput Time Explorer and - if you have implemented any - Custom KPI Views. To learn how to add Custom KPIs, please refer to the according section of the Process Explorer in the chapter Editing Analysis Documents.
, it is possible to switch between the Frequency Process Explorer, Throughput Time Explorer and - if you have implemented any - Custom KPI Views. To learn how to add Custom KPIs, please refer to the according section of the Process Explorer in the chapter Editing Analysis Documents.
The Throughput Time Explorer shows the throughput time between the single nodes in days, hours or minutes:
Process Animation
You can animate your process in the Process Explorer by clicking ![]() . Your cases will be represented by
. Your cases will be represented by ![]() of different sizes. The size of the bubbles displays the number of aggregated cases. Their speed is accordingly to their throughput time.
of different sizes. The size of the bubbles displays the number of aggregated cases. Their speed is accordingly to their throughput time.
You can control the speed and the time at which the animation is playing with the following controlls at the bottom:
![]()
The animation can be stopped by clicking ![]() at the top left in the Process Explorer.
at the top left in the Process Explorer.
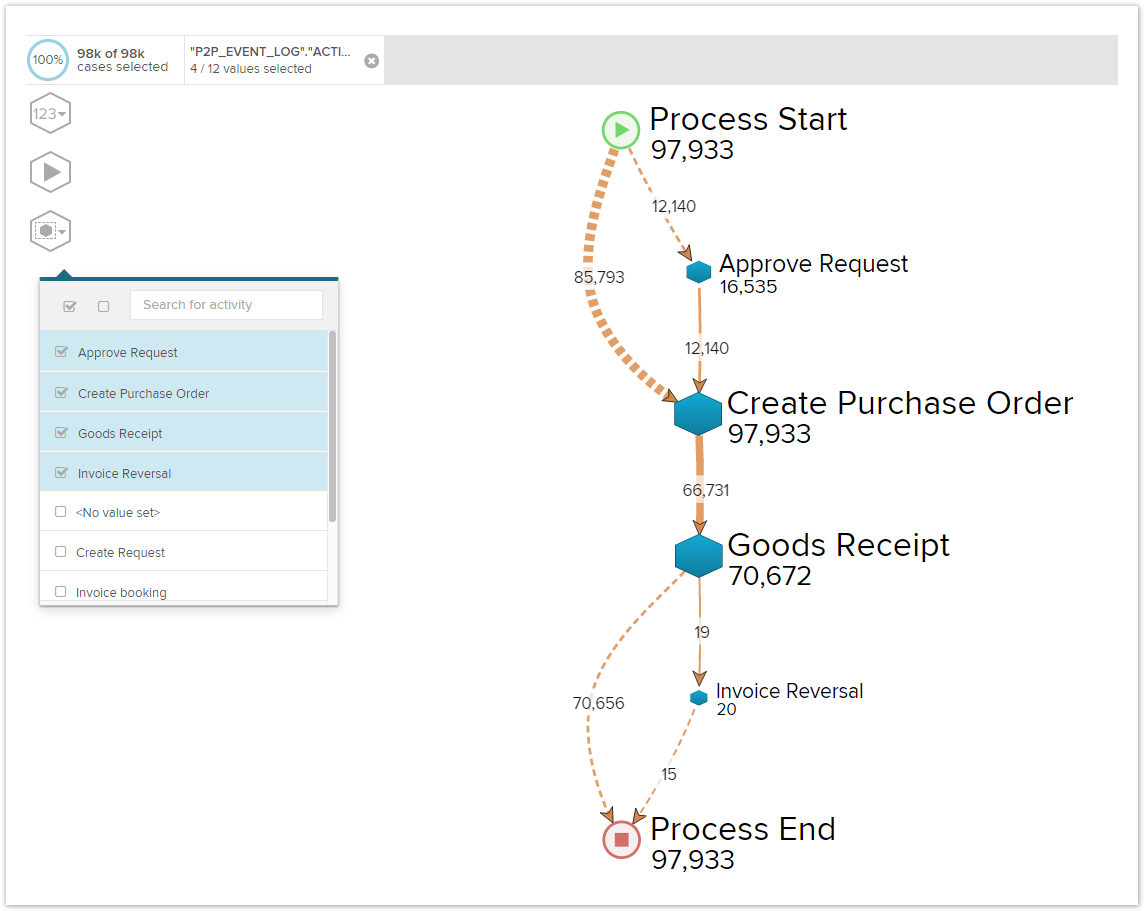
Inline Activity Chooser
The inline activity chooser of the Process Explorer can be accessed by: ![]() .
.
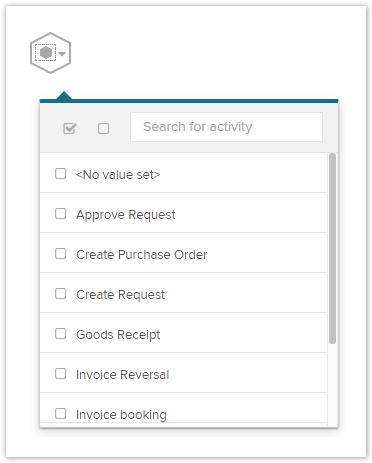
With the inline activity chooser, it is possible to directly create selections based on the activities. By selecting several activities, a selection is created and only the selected cases will be shown in the entire analysis: