You will find yourself in front of KPIs and various charts. They are meant to give a quick overview over the available user's and their activities.
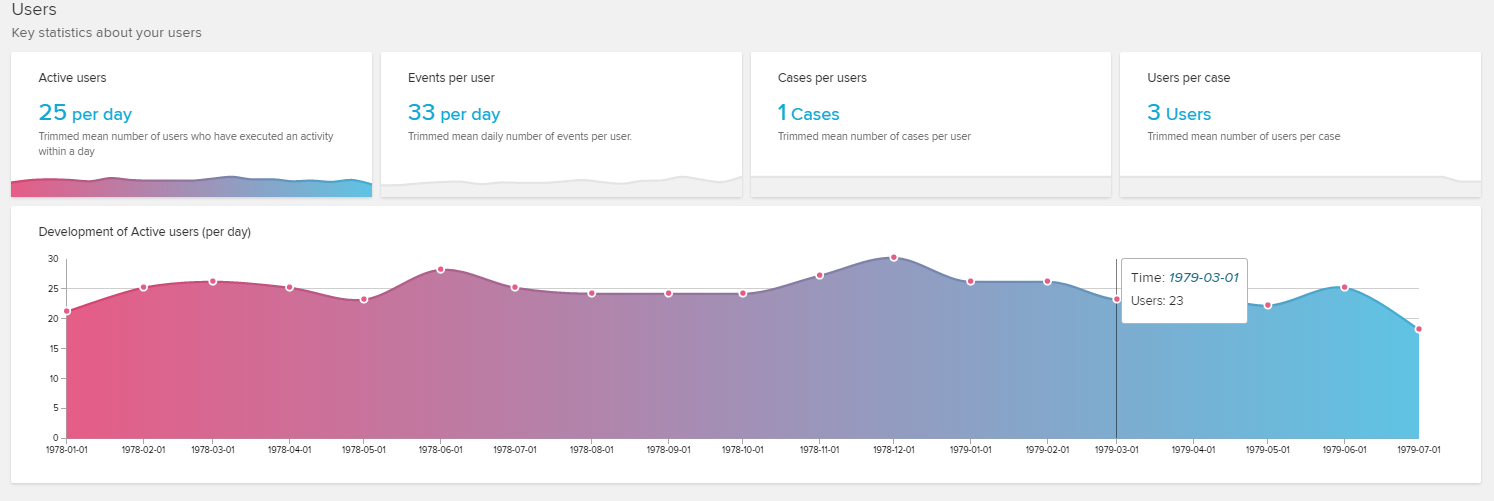
This first section is made of 4 KPIs and an Area Chart, scetching the development of active users per day over a given period of time (see below).
The following KPIs are available:
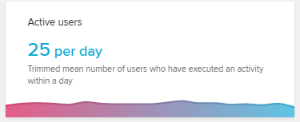
Mean count of users that have been active per day performing any activity in the given period of time.
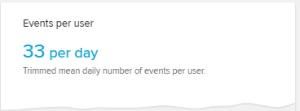
Mean count of events (= performed process activities) that a user has completed per day in the given period of time.
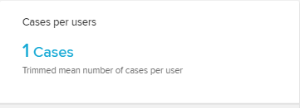
Mean count of cases (without regarding their individual number of passed activities) that a user has been working on per day in the given period of time.
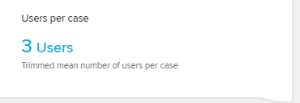
Mean count of users that have been working on the same case per day in the given period of time.
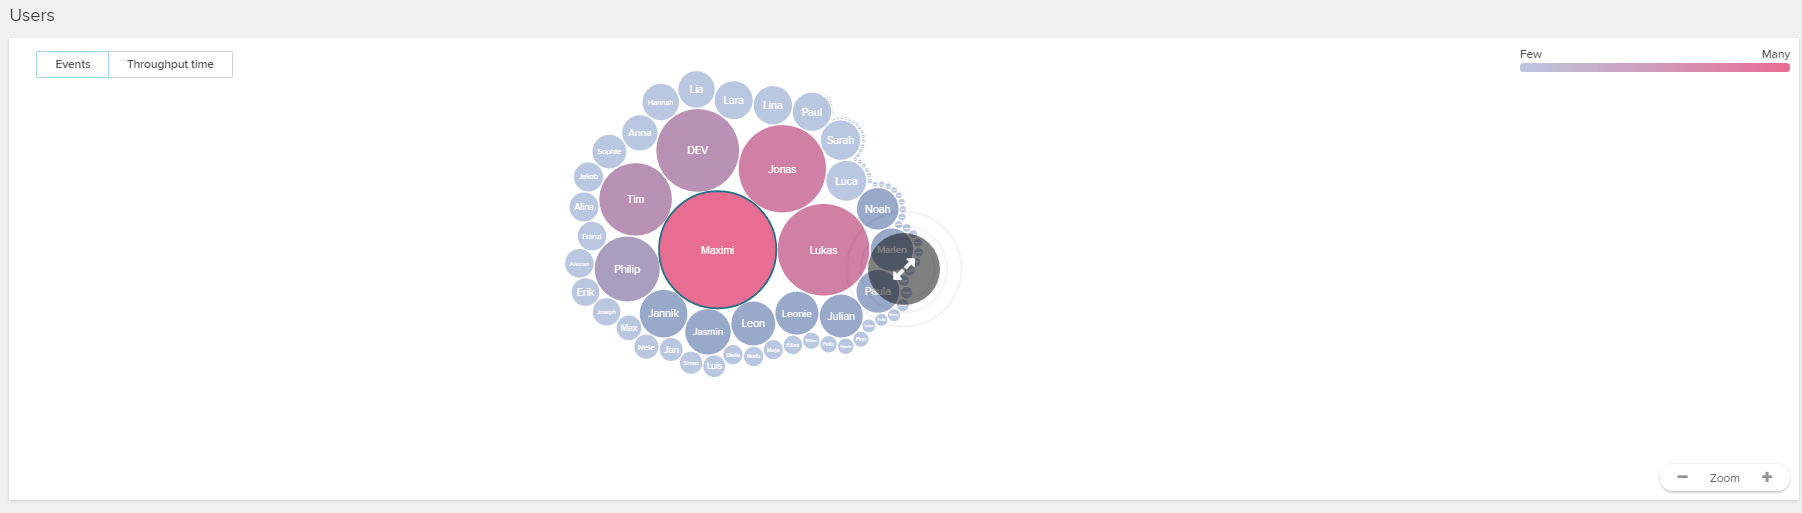
In PI Social, every user has a user profile, which evaluates the activities and cases that he has been performing.
This feature is available in the Users section.
Click on the following view in your PI Social to access the Users section.
Time
As already mentioned, the PI Social analysis is based on a given period of time.
This period of time can be configured in the upper right corner of the Overview section:

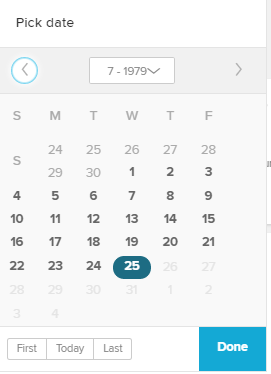
Choose a timeframe in the dropdown-menu.
You can choose between some given presets (Last 7/30/365 days, all time) or define a custom period of time with the From and To datepicker.
Choosing a preset, the From and To fields will be adopted accordingly.
Please Note
Please note, that the datepicker fields hide all days, that have not been assigned any activity to, in a grey color.
They can not be picked to border your timeframe.
The defined period of time is the base for the whole PI Social analysis.
Configuration
There are some further configuration options available with the ![]() icon:
icon:
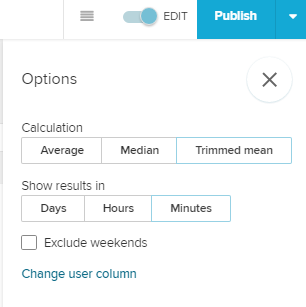
With these options, you can base the counting algorithms on an Average, a Median or a Trimmed mean (default).
Furthermore, you can show all results in the charts and KPIs in days, hours or minutes.
The Exclude weekends checkbox will only focus the user analysis towards activities that have been performed on working days (to be set in the global System Settings).