Celonis Process Mining brings 100 % transparency to all your processes. Learn how you can analyze your whole process within seconds and generate actionable insights from the automatically generated Celonis analyses.
Content
0) Example Eventlog
If you do not have your own eventlog yet, you can use the following example to follow the usecase: Eventlog_P2P_Process.xlsx
1) Upload an eventlog

Click the image to see the Video
- Drag and drop the eventlog-file to the upload section that is available on empty projects
- Confirm the Preview
- Check if all data-types are correctly recognized and continue
- Flag the CaseID- , Activity- and Eventtime-Column in the eventlog.
- Finish and create the default-analysis
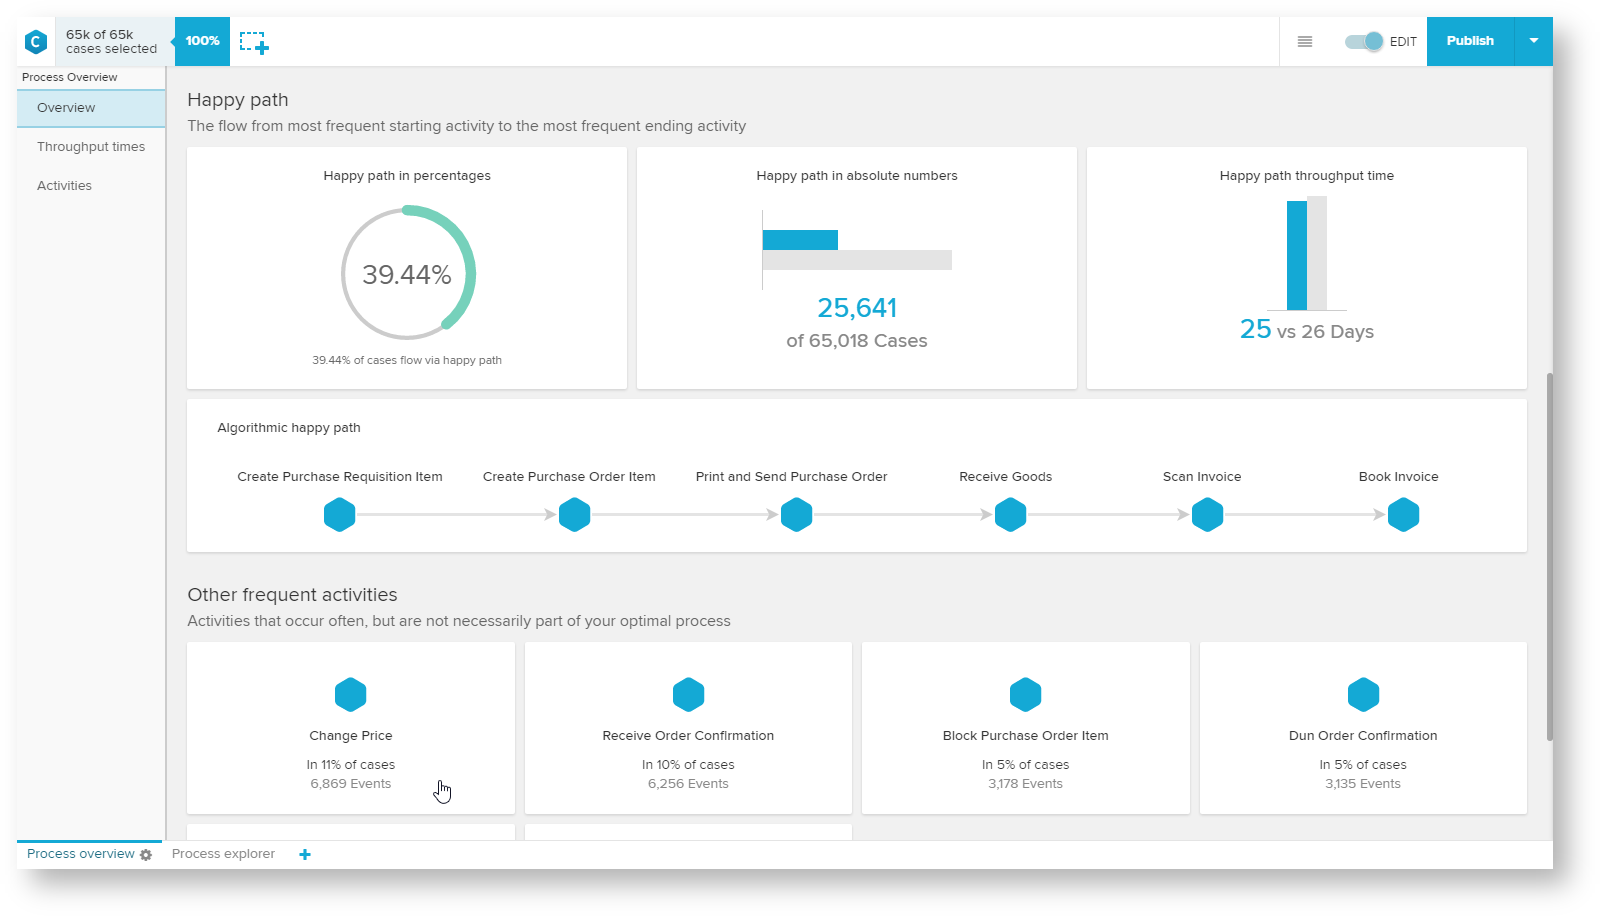
2) Process Overview
- The first view generated in the default analysis is the Process Overview
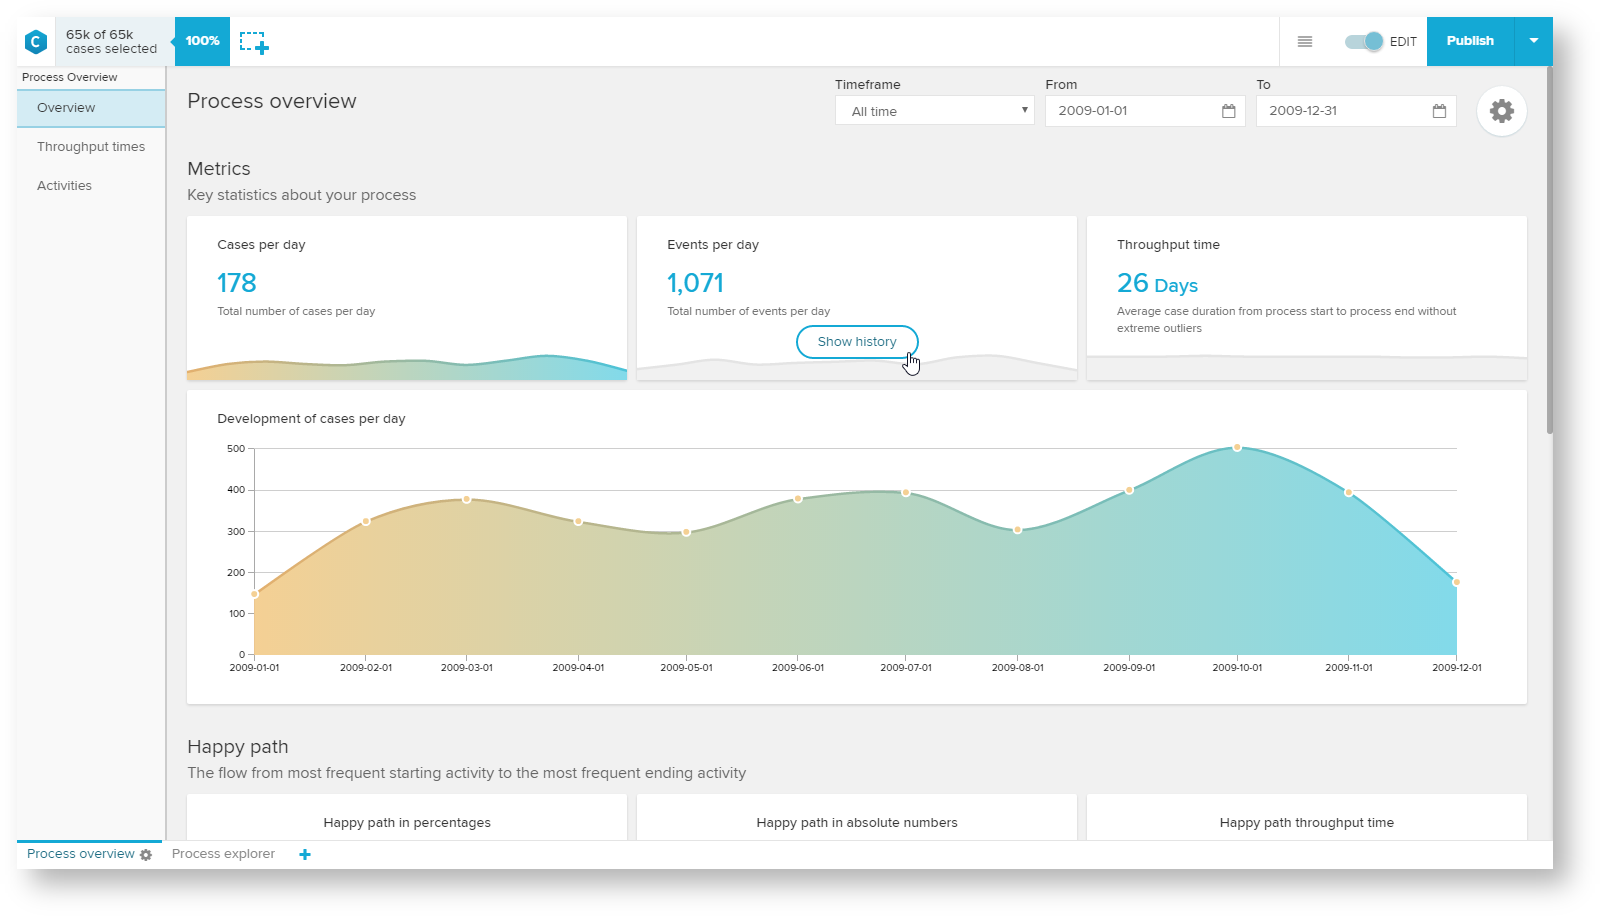
- First the Overview shows you how the cases, events and overall throughput time in your process have developed over time
- You can choose between the different KPIs by clicking on the tiles at the top
Note that in our Purchase to Pay example the distribution of cases over time is rather constant over time with only one exception, a peak in October.
This summary over time immediately highlights when highs or lows in the order volume might have caused problems, and which timeframe you can concentrate on first with your analysis.