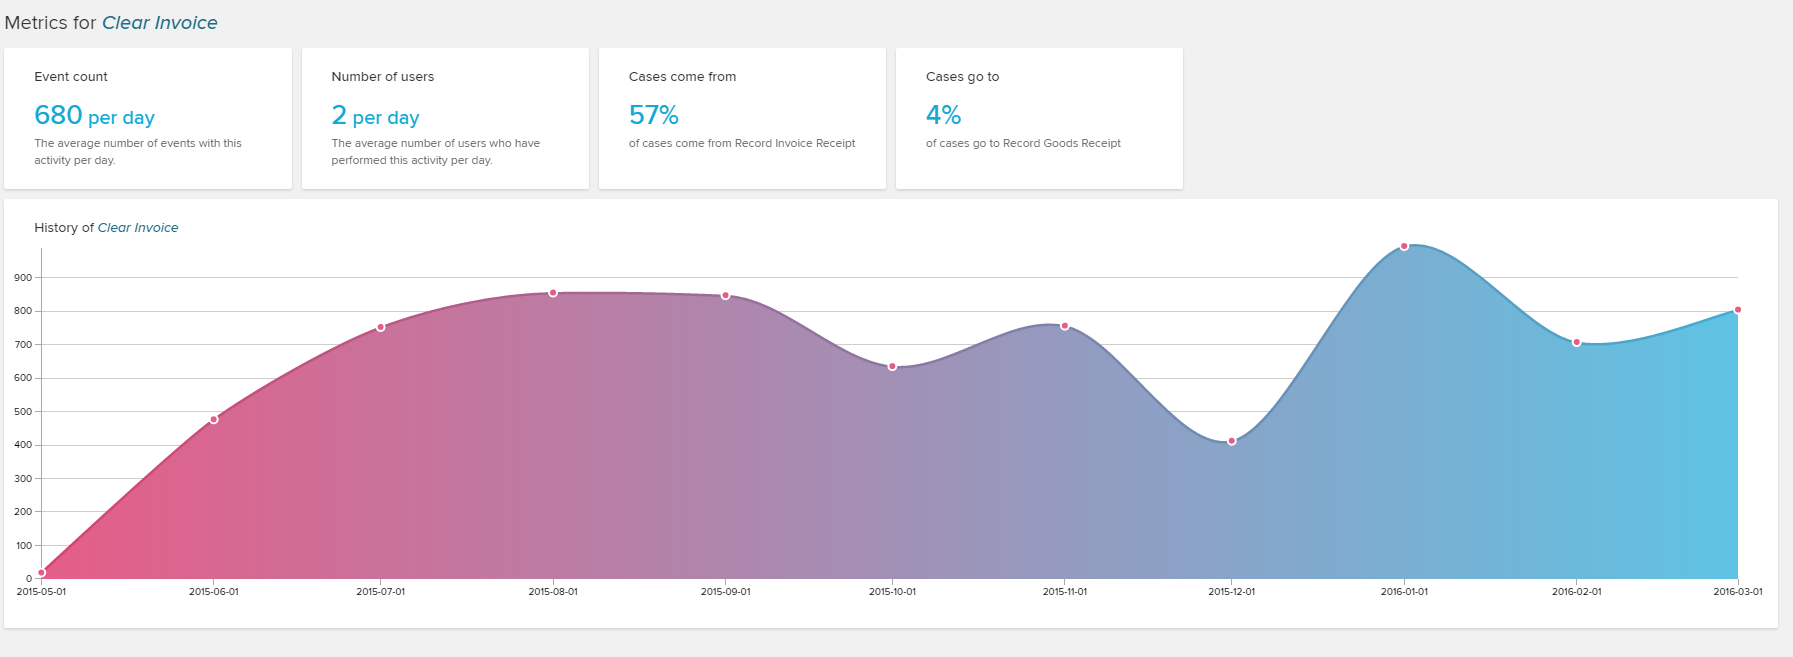
For all activities, a profile is created - just as the user profile.
In the upper part of the profile, you will find an Area Chart reporting on the usage frequency of this activity over time.
Furthermore, 4 KPIs are available. They display the event count, number of users per day, previous-/following activities on an average/median basis, depending on your timeframe settings.

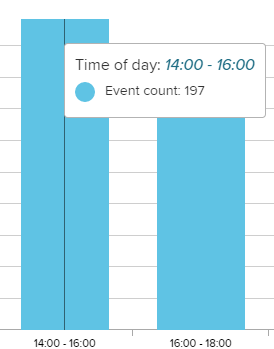
The lower part of the screen is covered by the daily distribution of the selected activity.

Hover any column to see a detailed count of the activity in the selected timeframe.

Between those two charts, you will find a user overview.

Please follow the instructions in PI Social Users to get a detailed explanations on the user profiles.
Please note however, that this overview is restricted by your current activity.