After selecting the Process Explorer for your new component (see Figure 3.7), you will be prompted with the Process Configuration screen shown in Figure 3.8.
Basically you could just click Done now and the component would already be functioning with the default settings. However, it might make sense to adjust some of the settings to your personal preferences.
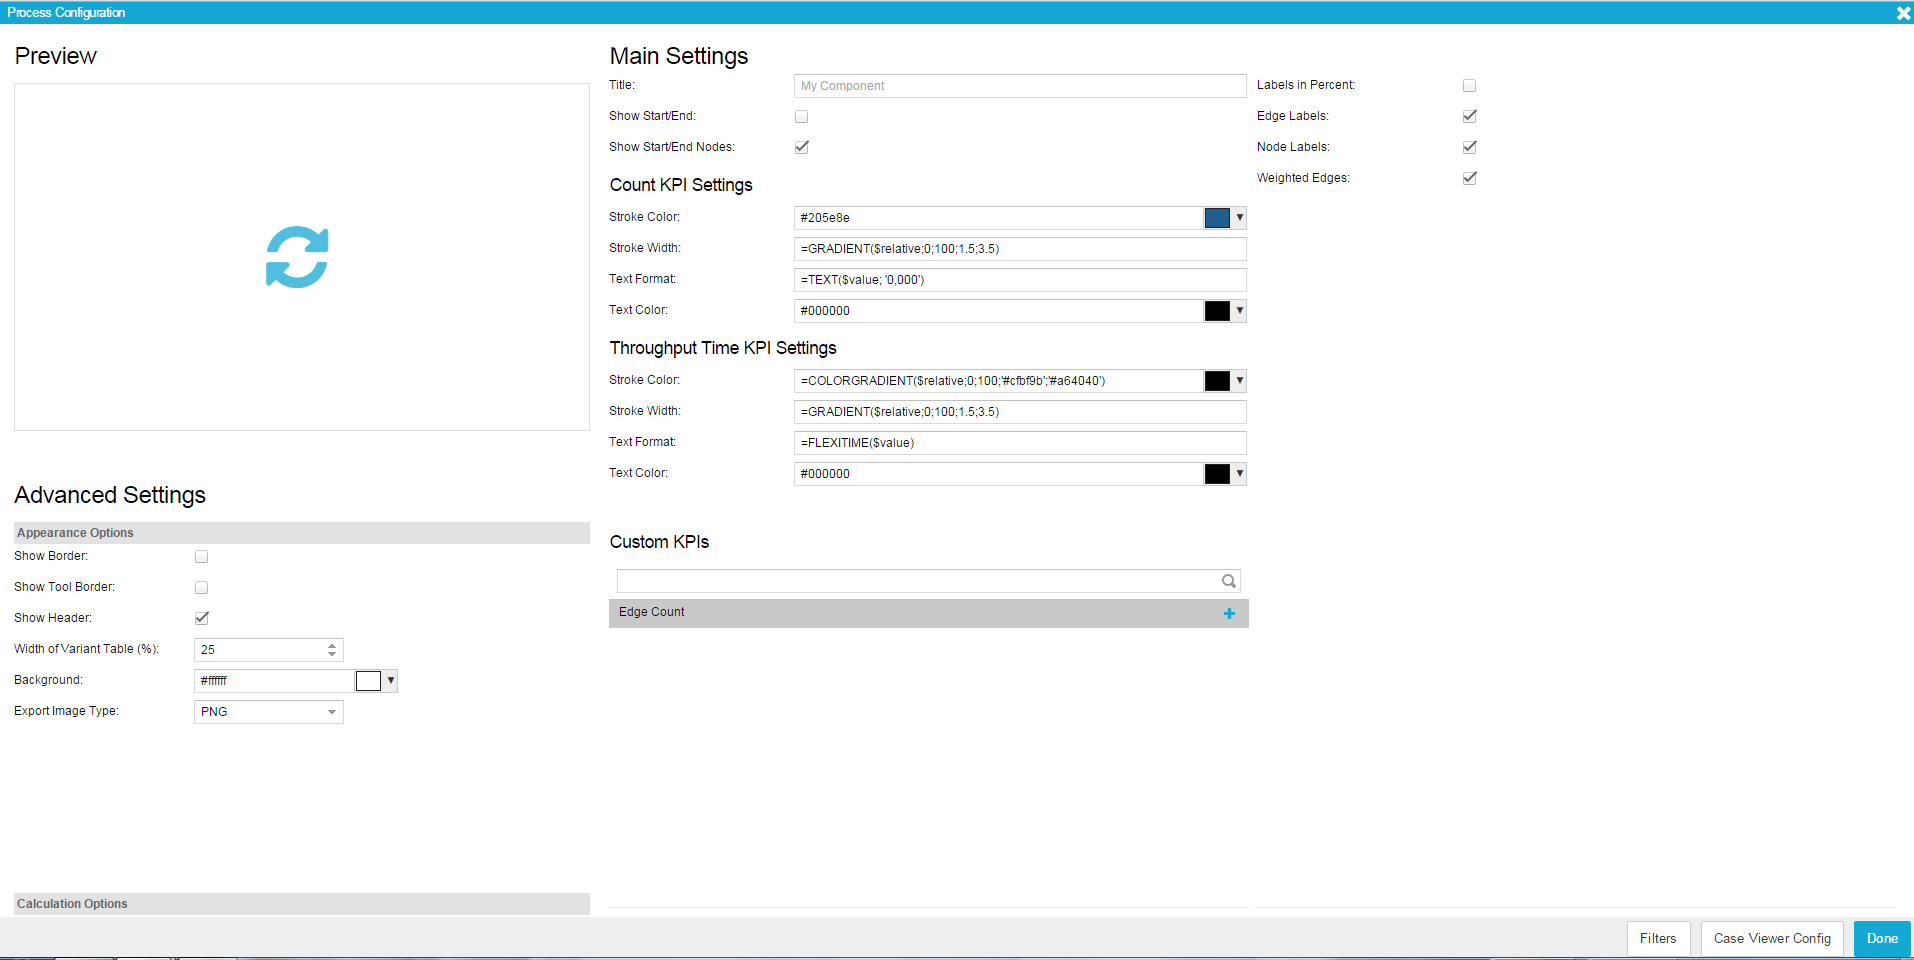
Figure 3.8: Process Explorer - Configuration
Preview
The preview slot is the most easily understandable part of the configuration screen. While configuring your Process Explorer, simply click on the slot to see what your current process looks like. That way you can easily try different forms of presentation for your data and select the one most suitable for your purposes. Since the preview slot does not update automatically, you need to click on it every time you want changes to appear.
Main Settings
In the Main Settings you can specify a title for your Process Explorer as well as choose between different general options for presentation.
- Title: Use a meaningful title for your Process Explorer, which will be shown directly on top of it. If you do not think a title is necessary, the field can be left empty.
- Show Start/End: If this option is activated, the number of cases beginning or ending in a process node will be represented by red (cases ending there) and green (cases starting there) columns inside the node. Depending on the number of cases, the columns will grow in size.
- Show Start/End Nodes: Activating this option will insert nodes representing the start and end points into the process model. All processes will then start with the “Start”-node and end with the “End”-node.
- Layout Horizontally: Normally, the process layout will be arranged in chronological order along a vertical line. If you activate this option, the process layout will be horizontally, meaning that the process steps will be arranged along a horizontal line (but still in chronological order). You can also switch between vertical and horizontal layout by using the Layout Options in the Top Navigation Bar of the Process Explorer.
Count KPI Settings
The Count KPI is one of the standard process KPIs predefined in SAP Process Mining by Celonis . It will show the number of distinct cases passing through a certain process edge or node.
- Stroke Color: Define here the base color of the process edges. Colors can either be chosen by using the color picker appearing when clicking into the input field or standard colors like “black”, “red”, “blue”, “yellow” and “green” can also be defined via text input. If you want to define a range of colors depending on the number of cases running through a process edge, you can also use the COLORGRADIENT function
- Stroke Width: This option is used for setting the width of the process edges. Either insert an absolute numerical value or use the GRADIENT function to define relative values depending on the number of cases passing through the process edge.
- Text Format: Here you can define the format of the numbers displayed on the process edges using the TEXT function. Decide here if you want to show thousands separators and decimal separators or if you want to add text using concatenation.
- Text Color: Define the color of the text shown on the process edges. Colors can either be chosen by using the color picker appearing when clicking into the input field or standard colors like “black”, “red”, “blue”, “yellow” and “green” can also be defined via text input.
Throughput Time KPI Settings
The Throughput Time KPI is one of the standard KPIs predefined in SAP Process Mining by Celonis . It will show the time it took for transitioning between single process steps and display it on the process edges.
- Stroke Color: Define here the base color of the process edges. Colors can either be chosen by using the color picker appearing when clicking into the input field or standard colors like “black”, “red”, “blue”, “yellow” and “green” can also be defined via text input. If you want to define a range of colors depending on the time it took for transitioning between process steps, you can also use the COLORGRADIENT function.
- Stroke Width: This option is used for setting the width of the process edges. Either insert an absolute numerical value or use the GRADIENT function explained in Chapter 3.4 to define relative values depending on the time it took for transitioning between process steps.
- Text Format: Here you can define the format of the numbers displayed on the process edges. For Throughput KPI, normally the FLEXITIME function will be used. FLEXITIME automatically assures the correct and intuitive presentation of time values.
- Text Color: Define the color of the text shown on the process edges. Colors can either be chosen by using the color picker appearing when clicking into the input field or standard colors like “black”, “red”, “blue”, “yellow” and “green” can also be defined via text input.
Custom KPIs
The Custom KPI's section shows all available KPIs defined by tou. To define a new KPI, simply choose the predefined KPI "Edge Count" shown in the list and click on the "+"-icon. Edge Count will be added to the Custom KPI list on the right side of the Custom KPI's section (as shown in Figure 3.9) and you can start configuring your own KPI based on it by clicking the small screwdriver icon. The configuration of KPIs will be explained in the following section.

Figure 3.9: Process Explorer - Custom KPIs
- Edit: To edit the settings of a custom KPI, click on the screwdriver icon appearing next to it (see Figure 3.9). You will be forwarded to the edit menu which will be explained in the following Section.
- Delete: To delete a custom KPI, click on the small rubbish bin icon appearing next to it (see Figure 3.9).
- Change Order: To change the order of custom KPIs, simply click on the respective list entry and drag-and-drop it to the desired spot.
Edit Custom KPI
The configuration menu is the same for the configuration of custom KPIs as well as for the coniguration of dimension and aggregation settings for charts and tables. Therefore, some of the menu items do not have any effects for custom KPIs. The following section will concentrate only on the settings relevant for custom KPIs. The rest of the settings will be explained in the context of configuring charts and tables.
Name and Formula
- Name: Choose the name for your custom KPI that will be shown in the KPI list of the Process Explorer. In general, it is recommended to assign meaningful names making it easy for users to understand the purpose of the KPI.
- Formula: This is the most important field when configuring custom KPIs. Here you need to insert your formula for calculating the KPI according to PQL-Syntax. All PQL functions can be used in this field, making it a very powerful instrument to adapt KPIs to individual needs.
Font and Forma
- Font Color: Choose the color of the font your KPIs are displayed in either by using the color picker appearing once you click into the input field or by typing the labels of common colors such as “black”, “white”, “red”, “blue”, “green” and “yellow.
- Number Format: Here you can specify the format of the KPI values. The drop down menu contains a number of predefined formats to choose from. However, formats can manually be adjusted in the Format Code field directly above the dropdown menu.
Chart Appearance
- Line Color: This options affects the color of the process edges when the custom KPI is used. Use the color picker appearing when clicking into the input field or type common color labels such as “black”, “white”, “red”, “blue”, “green” and “yellow” to choose your desired color.
- Line Width: This option affects the width of the process edges when using the custom KPI. Define the width of the line by typing in an arbitrary positive number.
Advanced Settings
Appearance Options
- Show Border: After enabling this box, a subtle border and shadow will be shown around the explorer, giving it a more elaborated look.
- Show Tool Border: After enabling this box, a subtle line will be shown between the actual Process Explorer and the top navigation bar and title.
- Width of Variant Table (%):Insert a numerical value between 10 and 90 to define the width of the process variant list on the left side of the Process Explorer. A value of 10 will lead the variant list to take up 10% of the space provided in the Process Explorer. If you do not specify the variant list width, the default value is 25. Please note, that the variant list will only be shown if you activate it in the top navigation bar.
Calculation Options
- Filter self by Selection: Normally when you choose a process node or edge as your basis for dynamic filtering, the filter will also be applied to the Process Explorer itself (meaning the Process Explorer will then only show the cases conforming to the filter criteria). Activating this box will force the Process Explorer to stay the same when a dynamic filter is applied to it while all other components in the analysis will still be filtered according to the selection made.
- Apply selection to this component:If this option is activated, the Process Explorer will react to any dynamic filtering done within another component and adapt to the filtering basis selected. Since this option is the prerequisite for the powerful dynamic filtering to work, it will be enabled by default.
- Don’t apply selection to this component: Although the dynamic adaptation of all analysis components to a filtering selection made is one of the most powerful features in SAP Process Mining by Celonis , sometimes you might want to exclude the Process Explorer from adapting to filters. By activating this option, the component will become insensible to selections made within other components. It will also become insensible to selections made within itself (just as if the “Filter self by Selection” option was switched off).
Filters and Case Viewer Configuration
In the lower right corner of the Process Configuration menu you will find the filters and Case Viewer Config button.
Filters
The filters button is available in the most components and gives you the possibility to define a filter that will be applied only fo this component. If you apply a filter, only the data conforming to the filter criteria will be choosen as basis for the Process Editor. For the definition, any statement made in PQL can be used.
Case Viewer Config
The Process Explorer has a built-in case viewer component that can be displayed via the top navigation bar. By clicking on the “Case Viewer Config” button, you can add or remove columns (dimensions and aggregations) you want to display in it. You can also limit the number of cases you want to consider in the Case Viewer.
For the configuration of dimensions and aggregations, the same options as for configuring dimensions and aggregations in charts and tables are available.