You are viewing an old version of this page. View the current version.

Compare with Current View Page History

« Previous Version 3 Next »

The Visual Editor offers a graphical user interface to "build" dimensions and KPIs with Drag&Drop.

The first step after the creation of a custom dimension or custim KPI is to choose a category. This will create a template in the main area with recommended connections.


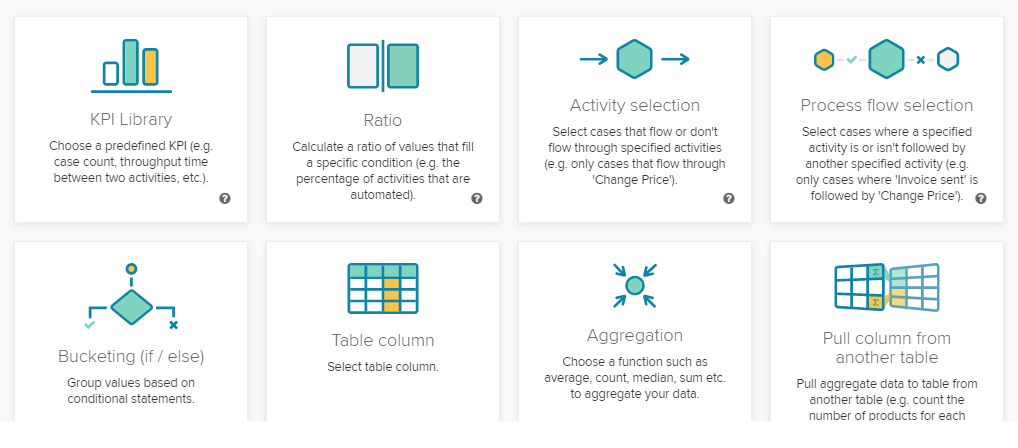
The following categories are available:


The KPI library stores predefined standard KPIs like the case count or the throughput time. It is also possible to save your custom formulas and re-use them from the KPI library.

The ratio block calculates the ratio of values that fullfill a ceratin condition. The only input that is required to do that is the condition itself. A condition can be a column or aggregation that matches a certain value or any process filter. You can choose between a simple ratio, a activity ratio, a process flow ratio and a custom ratio.

The activity selection block allows you to set a condition on the cases based on the activities they contain. You can specify if a case is flowing or not flowing through an activity or if a case is starting or ending with the chosen activity.

The Process flow selections allow you to set a condition on the path of the cases. You can define wich sequence of activities the cases flowing through. This includes the possibility to define direct and indirect connections between the single activities.

The bucketing allows you to split up your data according to a defined condition. You can set a condition on direct column values or aggregations. You can add multiple conditions to your formula and create as many buckets as you want. The conditioning can be used to calculate formulas based on the condition or simply label a dimension.

The table column block allows you to add a column from one of the tables in your datamodel to the a formula.

Aggregations allow you to apply operations on your data. The aggregations that are available are:

  • Average
  • Sum
  • Count
  • Count distinct
  • Count table
  • Maximum
  • Minimum
  • Medium standard deviation
  • Variance

The pull-up-function calculates the KPI on the table that was specified by the user. The calculations are therefore grouped on basis of the foreign key connection between the base table and the aggregated column. You can also set conditions on the calculation, so that only the data matching this condition is taken into consideration.

  • No labels