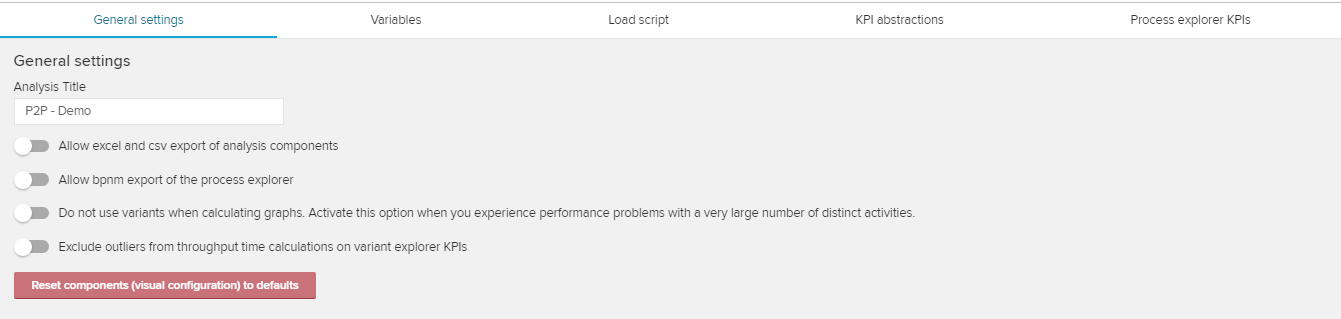
The following general settings are available:
If you activate this option, users are allowed to download Charts And Tables components as a .csv or as a .xlsx file.
Therefore, the following option will be added to the component menu (right-click on any component):
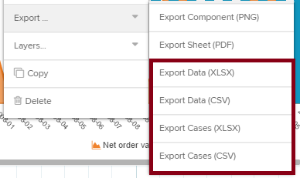
For each component, users can choose wether they want to export the cases, or the data.
Exporting data will generate a list that includes all aggregated values (= cases) by the component's KPIs.
This is for example interesting, if you are only interested in the displayed data of a column chart.
Exporting cases will export all cases with all column values of all existing cases.
The generated file will most likely contain a huge amount of data.
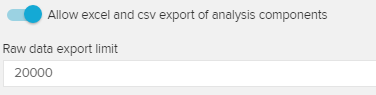
To limit the amount of exported data, you can set a raw data export limit.
The generated file will not exceed the given number of rows (and might "cut" the data according to your component's sorting policy).
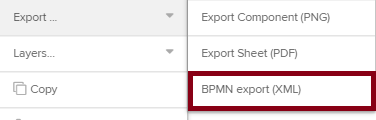
You can export the Process Explorer as Business Process Model (BPMN).
Therefore, activate the checkbox.

The following option will appear in the component menu of the process explorer.
If you activate this option, variants won't be regarded while calculating graphs (i.e. the Process Explorer).
For more information on variants, we recommend to read the section about the Variant Explorer.

This can solve problems considering performance, if you are working with a large number of distinct activities.
Activate this option to exclude the outliers from the throughput time.
5% of the throughput time values with a high deviation will be removed.

This might help you to focus on the most common times, or to exclude possible errors/false values in your data source.