All listed users in your data model are assigned a user profile in PI social.
The uppser section of a user's profile offers some general options, KPIs and timeframe settings.
The timeframe settings are the same that we already introduced in the Overview.
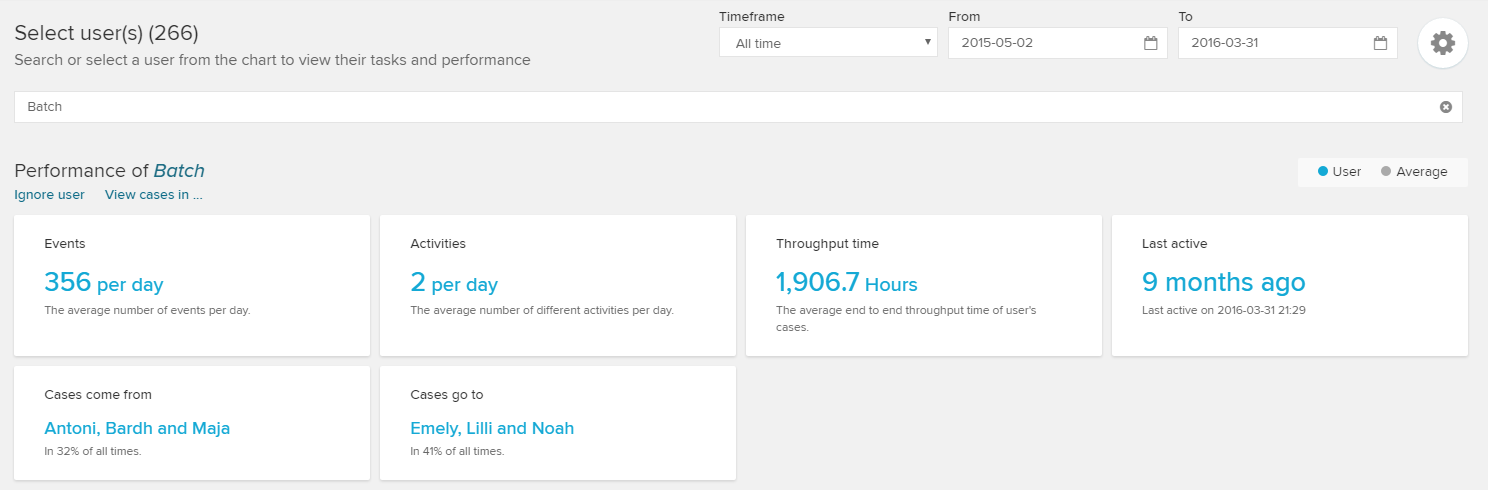
Next to the three well-known KPIs (Events per Day, Activities per day, Throughput time) a last active KPI is introduced in the first row.
This KPI simply displays the time that has passed since the user has been active in the system (and performed any activity).
The following additional KPIs are introduced in the second row:
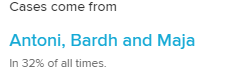
This KPI displays the three (other) users that worked on a previous activity in the most common process variant.
The variant's share is displayed in the grey text below the users.
This KPI displays the three (other) users that worked on any subsequent activity in the most common process variant.
The variant's share is displayed in the grey text below the users.
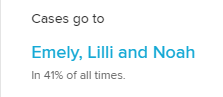
As you will notce, this KPI is very similar to the Cases come from KPI.
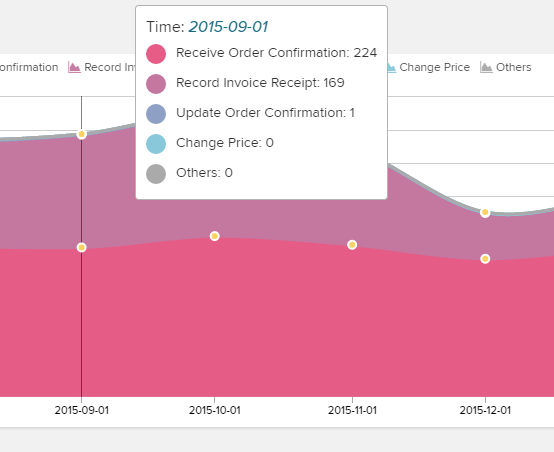
The following Area Chart reports on the user's most frequently performed activities.
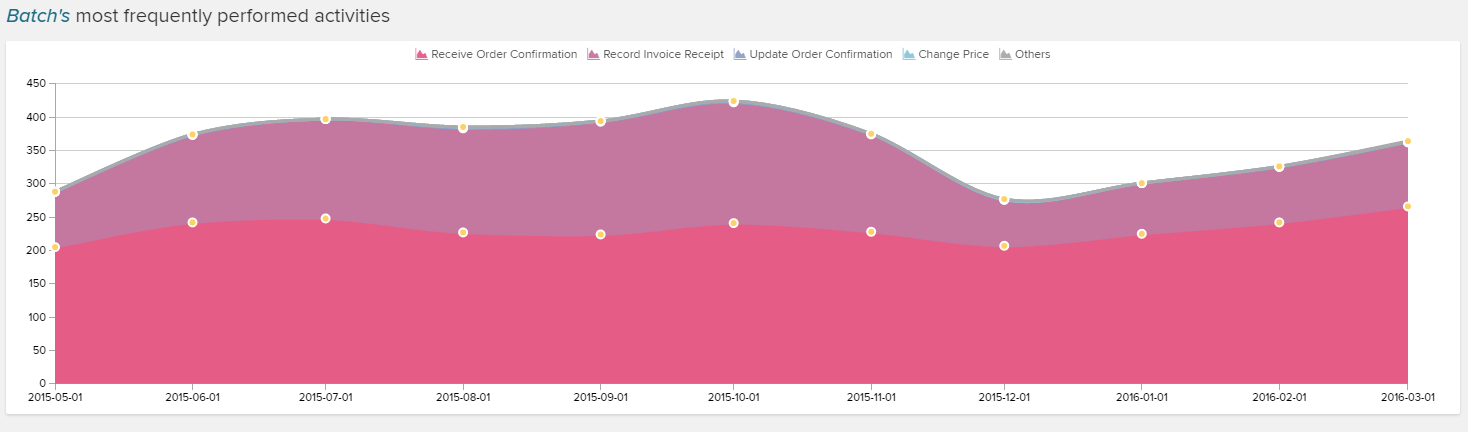
Activity Performance Details
Hover the chart area, to see a detailed evaluation of the selected timestamp, including all performed activities.
There is another chart at the bottom of the user's profile.
The daily profile chart comes as a