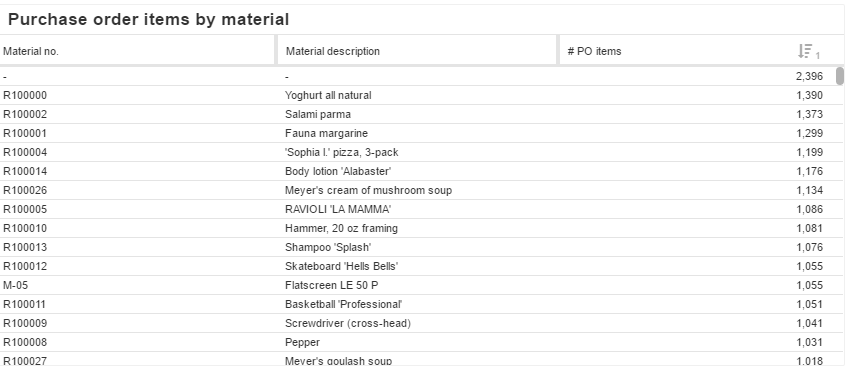
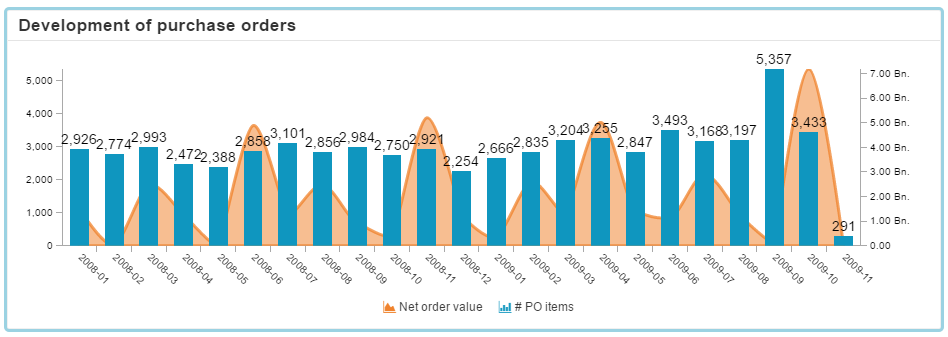
Charts and tables are used to illustrate certain data in an intuitive way.
The following components are available and explained on these subpages:
 > Charts And Tables > piechart.png")
 > Charts And Tables > donut.png")
 > Charts And Tables > linechart.png")
 > Charts And Tables > image2016-10-7 16-20-16.png")
 > Charts And Tables > worddav61ef1c515b64c89cfc69bfcd02e15a0b.png")
 > Charts And Tables > worddav1c5fda101ab414d49daca4b703881cfe.png")
 > Charts And Tables > worddavfe0b9ccc9576fb5f984de8063002a644.png")
 > Charts And Tables > image2016-10-11 11-38-7.png")
Charts and tables are used to illustrate certain data in an intuitive way.
The following components are available and explained on these subpages: