| Name
|
Size
|
Creator |
Creation Date
|
Last Modification Date
|
Labels |
Attached To |
|
PNG File charts_tables_alt_chart_type.png |
29 kB |
Michael Bauer |
Sep 07, 2015 15:57 |
Sep 07, 2015 15:57 |
|
Page: Diagramme und Tabellen (Analyse)
|
|
PNG File charts_tables_area.png |
38 kB |
Michael Bauer |
Sep 03, 2015 16:56 |
Sep 03, 2015 16:56 |
|
Page: Das Area Chart
|
|
PNG File charts_tables_area_spline.png |
38 kB |
Michael Bauer |
Sep 03, 2015 16:58 |
Sep 03, 2015 16:58 |
|
Page: Das Area Spline Chart
|
|
PNG File charts_tables_bar.png |
33 kB |
Michael Bauer |
Sep 03, 2015 16:52 |
Sep 03, 2015 16:52 |
|
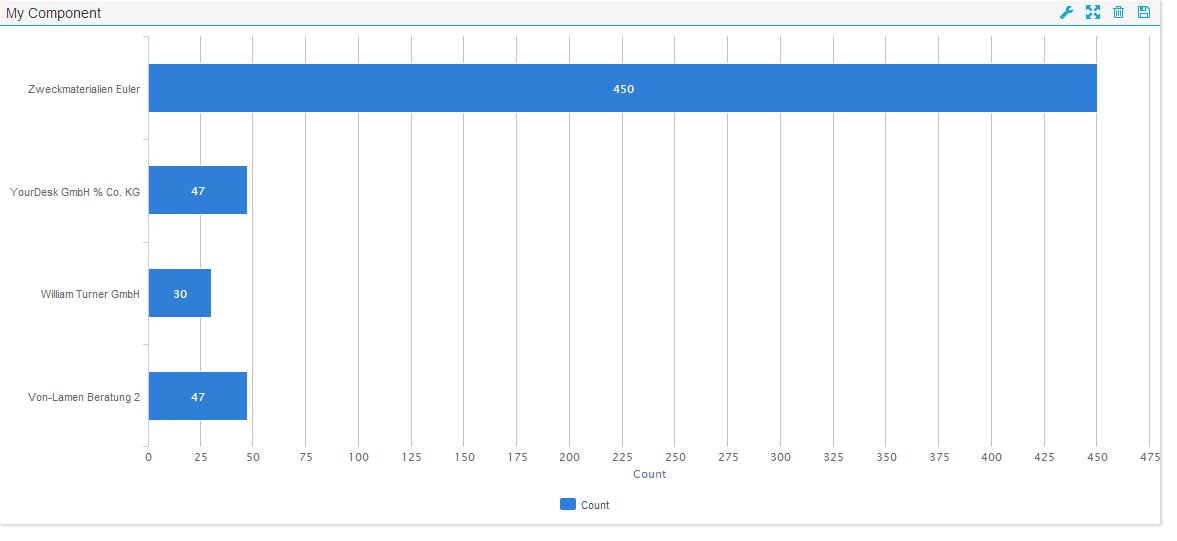
Page: Das Bar Chart
|
|
PNG File charts_tables_bubble_plot.png |
23 kB |
Michael Bauer |
Sep 03, 2015 17:09 |
Sep 03, 2015 17:09 |
|
Page: Das Bubble Plot
|
|
PNG File charts_tables_column.png |
30 kB |
Michael Bauer |
Sep 03, 2015 16:54 |
Sep 03, 2015 16:54 |
|
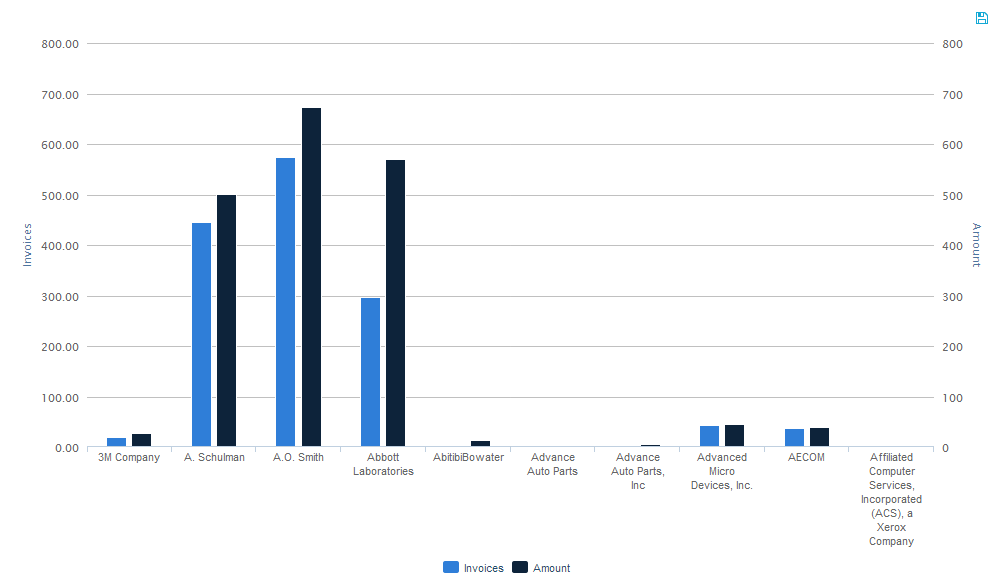
Page: Das Column Chart
|
|
PNG File charts_tables_donut.png |
43 kB |
Michael Bauer |
Sep 03, 2015 17:04 |
Sep 03, 2015 17:04 |
|
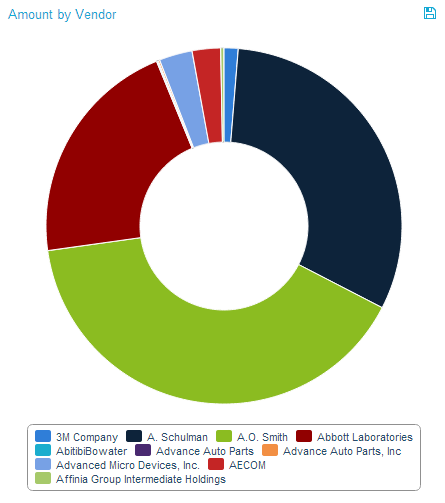
Page: Das Donut Chart
|
|
PNG File charts_tables_label_border.png |
30 kB |
Michael Bauer |
Sep 07, 2015 15:54 |
Sep 07, 2015 15:54 |
|
Page: Diagramme und Tabellen (Analyse)
|
|
PNG File charts_tables_line.png |
40 kB |
Michael Bauer |
Sep 03, 2015 16:46 |
Sep 03, 2015 16:46 |
|
Page: Das Line Chart
|
|
PNG File charts_tables_olap.png |
35 kB |
Michael Bauer |
Sep 03, 2015 16:26 |
Sep 03, 2015 16:26 |
|
Page: Diagramme und Tabellen
|
|
PNG File charts_tables_pie.png |
44 kB |
Michael Bauer |
Sep 03, 2015 17:01 |
Sep 03, 2015 17:01 |
|
Page: Das Pie Chart
|
|
PNG File charts_tables_pie_hidden.png |
40 kB |
Michael Bauer |
Sep 03, 2015 17:01 |
Sep 03, 2015 17:01 |
|
Page: Das Pie Chart
|
|
PNG File charts_tables_scatter_plot.png |
23 kB |
Michael Bauer |
Sep 03, 2015 17:05 |
Sep 03, 2015 17:05 |
|
Page: Der Scatter Plot
|
|
PNG File charts_tables_spider_web.png |
45 kB |
Michael Bauer |
Sep 03, 2015 17:12 |
Sep 03, 2015 17:12 |
|
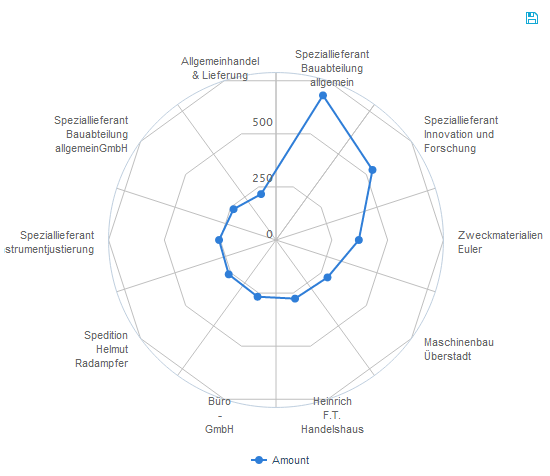
Page: Das Spider Web Chart
|
|
PNG File charts_tables_spline.png |
41 kB |
Michael Bauer |
Sep 03, 2015 16:49 |
Sep 03, 2015 16:49 |
|
Page: Das Spline Chart
|
|
PNG File charts_tables_time_series.png |
39 kB |
Michael Bauer |
Sep 03, 2015 16:40 |
Sep 03, 2015 16:40 |
|
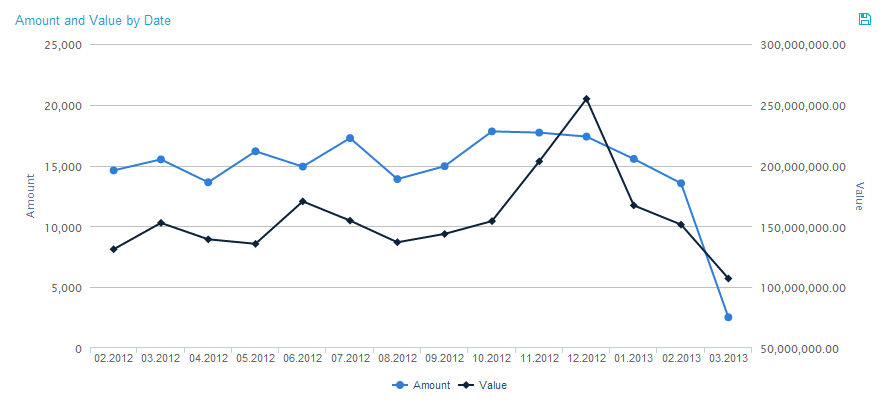
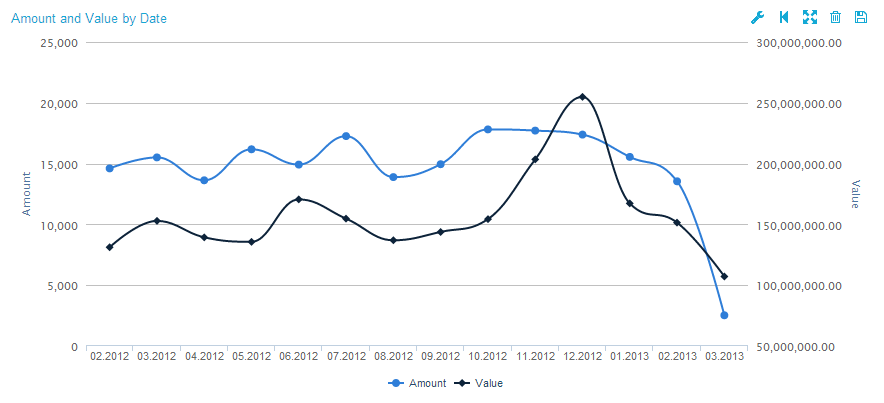
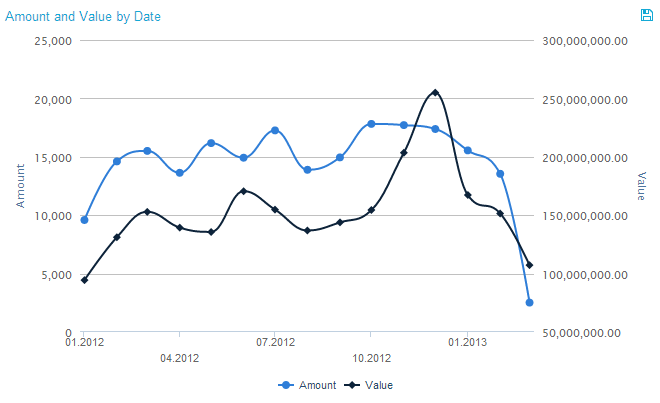
Page: Das Time Series Chart
|
|
PNG File charts_tables_time_series_filter.png |
42 kB |
Michael Bauer |
Sep 03, 2015 16:40 |
Sep 03, 2015 16:40 |
|
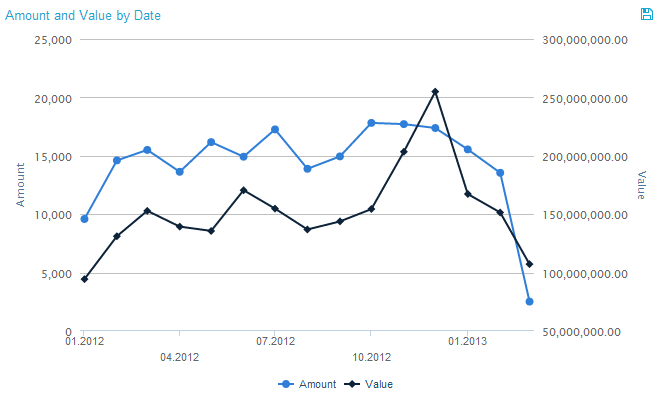
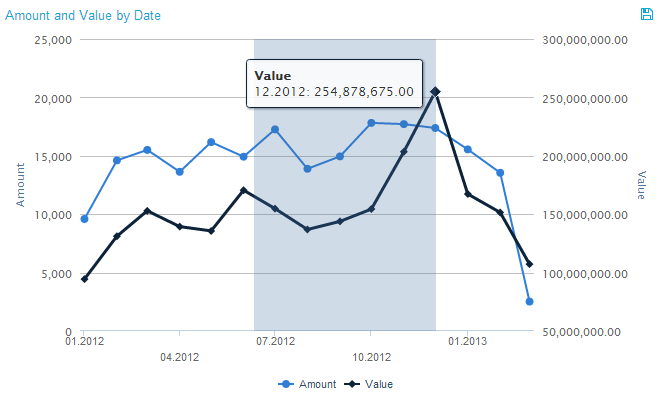
Page: Das Time Series Chart
|
|
PNG File charts_tables_time_series_spline.png |
39 kB |
Michael Bauer |
Sep 03, 2015 16:43 |
Sep 03, 2015 16:43 |
|
Page: Das Time Series Spline Chart
|
|
PNG File choose_layout.png |
26 kB |
Michael Bauer |
Sep 07, 2015 14:52 |
Sep 07, 2015 14:52 |
|
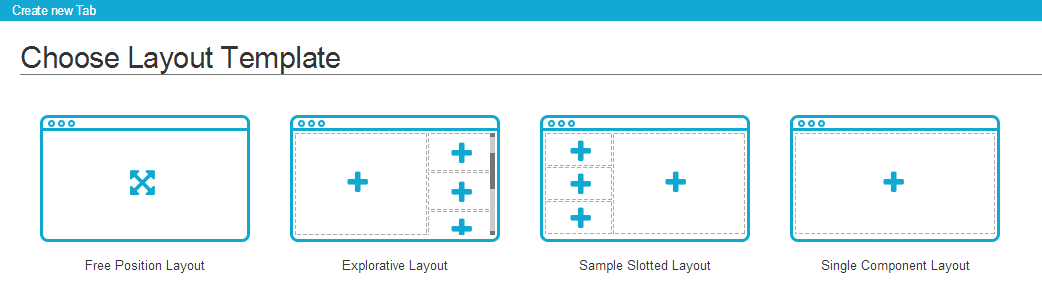
Page: Eine Analyse erstellen
|
|
PNG File choose_layout_DE.png |
13 kB |
Michael Bauer |
Sep 07, 2015 14:52 |
Sep 07, 2015 14:52 |
|
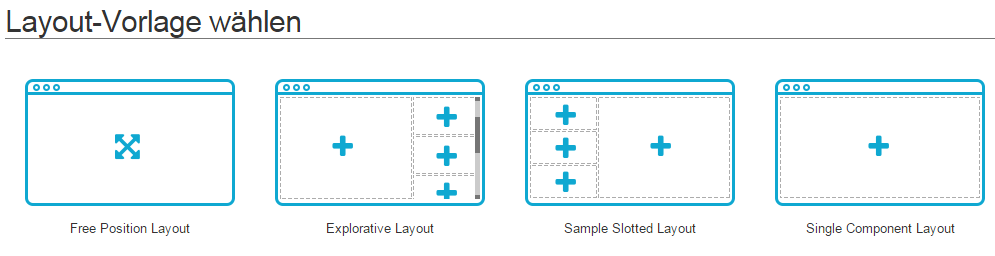
Page: Eine Analyse erstellen
|