A eA donut chart is very similar to a Pie chart.
It is based on numerical proportions of your dimensions and KPIs, however, only uses the border of the circle.
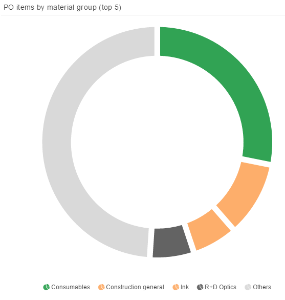
The following configurations are offered by a Donut Chart:
- Title Settings
- Dimensions & KPIs
- Sorting
- Advanced Settingsa
- Title Settings
- Title Formatting
- Border Options
- Background Options
- Legend Settings & Formatting