Charts and tables are made for visualizing aggregations over various dimensions. Therefore, all previous components included settings for both dimensions and KPIs.
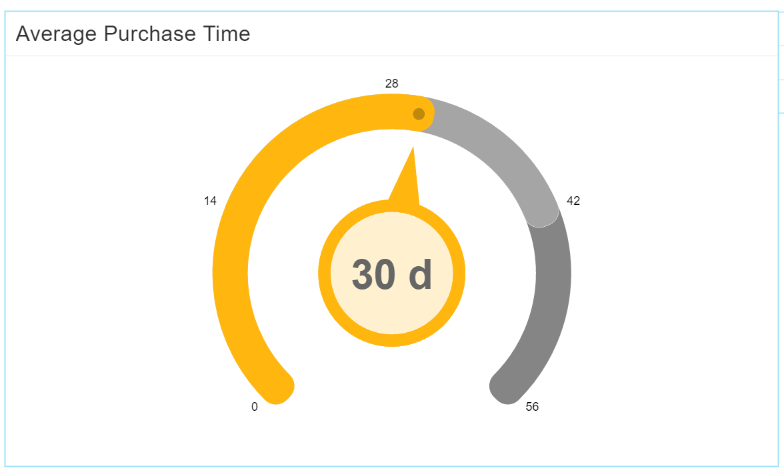
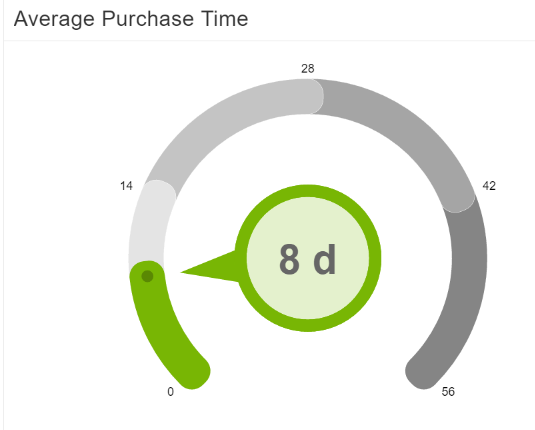
The Single KPI aims to illustrate a single aggregation without any dimensions. This is a usefull tool to get a very specific aggregation on the first view.
Configuration
As the configuration of the Single KPI differs from the configuration of the other chart & table components, you will find a detailed configuration description on the subpages.
The General Options and the Diagram Area are available.