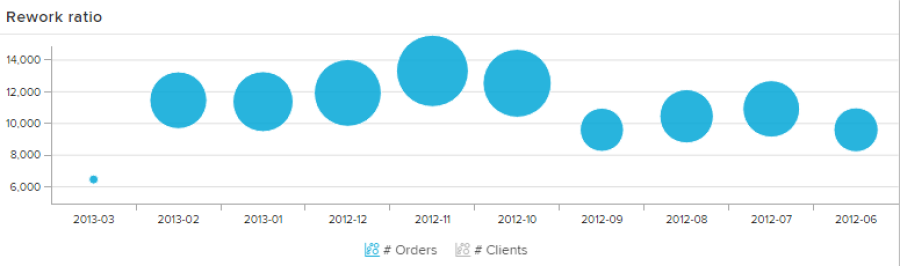
A Bubble plot is an extension of the Scatter plot.
If a second aggregation is used, that aggregation will determine the size of the bubbles in the plot, which make the Bubble Plot more intuitively understandable.
Configuration
The following configuration tabs are available in the component settings: