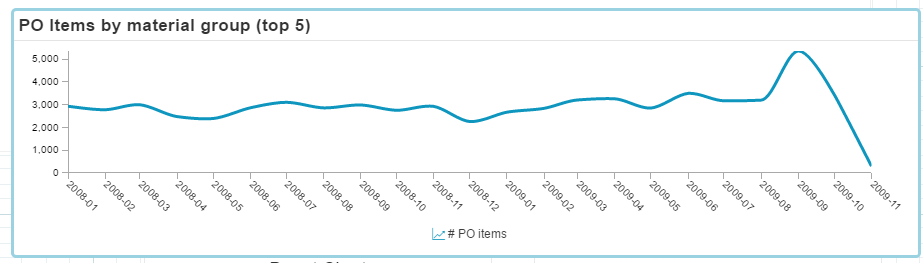
Line Charts connect points illustrating the trend of your selected data over a specified dimension (e.g. time).
This is a great way to illustrate your data flow over time.
| Tip | ||
|---|---|---|
| ||
It is very easy to convert charts (for example Column Charts) to a Line Chart diagramm! Open the General Options of your "old" chart, and choose "Line Chart" at the Component type dropdown. |
In the Settings, you will recognize the following Configuration Options: