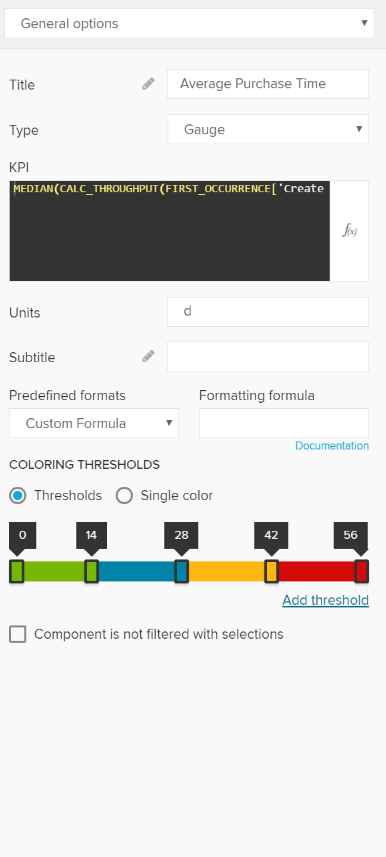
The following options are available in the General Options section:
| Expand | ||
|---|---|---|
| ||
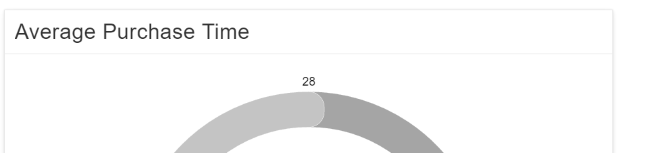
The title will appear above the Single KPI area in your analysis sheet.
Please specify your desired title into the text field.
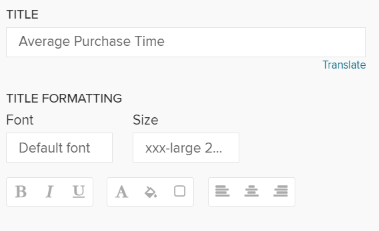
Next to the text field, a small pencil icon ( This will open the area options, or display the title configuration directly under the text field:
You may edit your font, its size ,text highlighting, colors (font-, background - and border color) and your text orientation.
|

| Expand | ||||||||||||||||||||
|---|---|---|---|---|---|---|---|---|---|---|---|---|---|---|---|---|---|---|---|---|
| ||||||||||||||||||||
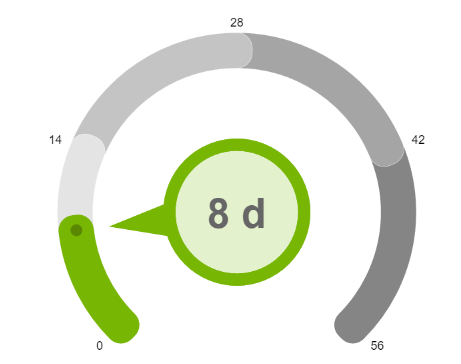
The Single KPI comes with 4 different types, that can be compared to skins.
Choose any type from the dropdown list. Let's examine the types a little further:
|


| Expand | |||||||||||
|---|---|---|---|---|---|---|---|---|---|---|---|
| |||||||||||
Enter your PQL statement in the KPI section. You can make use of the Formula Editor.
For the sample charts that are shown in the screenshot, the following PQL statement has been created with the formula editor to display the median time (in days) that a case in a Purchase-to-pay process needs from the Creation of a purchase order until the receiption of goods.
|