A data series section is set up for every dimension and KPI that has been created in your component (also see general options).
It offers options that are available in the Formula Editor.
The Data Series configurations differ a lot for different components.
For this reason, we strongly recomment to conduct the component's chapter, to know which options are available and relevant for a successful configuration.
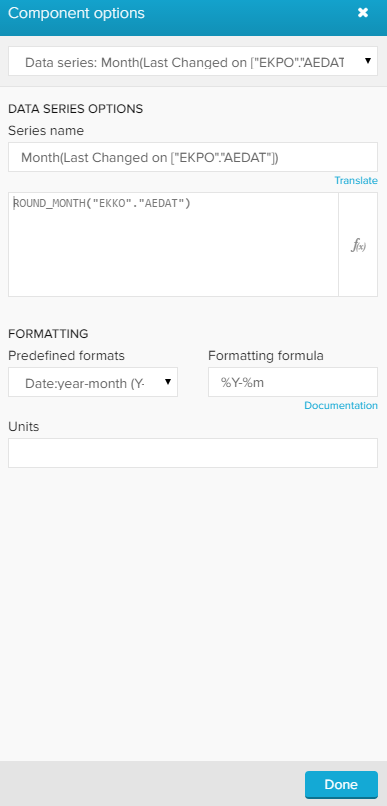
This screenshot shows the Data Series options that are available for all components.
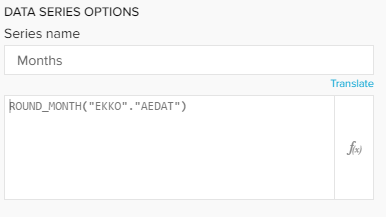
At the top of this section, you may change the Series name. This is the name that is displayed in the dimension section, the KPI section and the sorting section in the general options.
Furthermore, you can alter the KPI statement. Click on the small icon () on the right corner to edit the statement in the Formula Editor.
Please refer to the Dimensions & KPIs chapter for further explanations.
The following option is only available for OLAP Tables:
You can color the content of the table, as well as the background.
For both, you can either select a single color or apply a color mapping rule.
If you wish to color the table's content or the background in the same color, pick a color in the Text color or the Background color field.
If you wish to insert a custom css color, you can use the field in the lower row.
This method allows text - or background coloring according to different criteria.
For example, critical values can be highlited with a different color.
Click on the small ![]() icon to get started!
icon to get started!
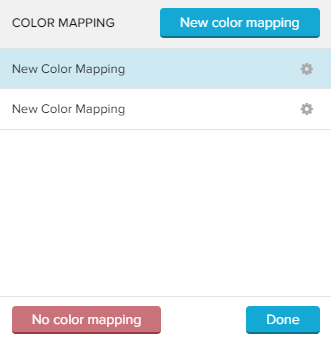
To add a new color mapping, click on  in the upper right corner.
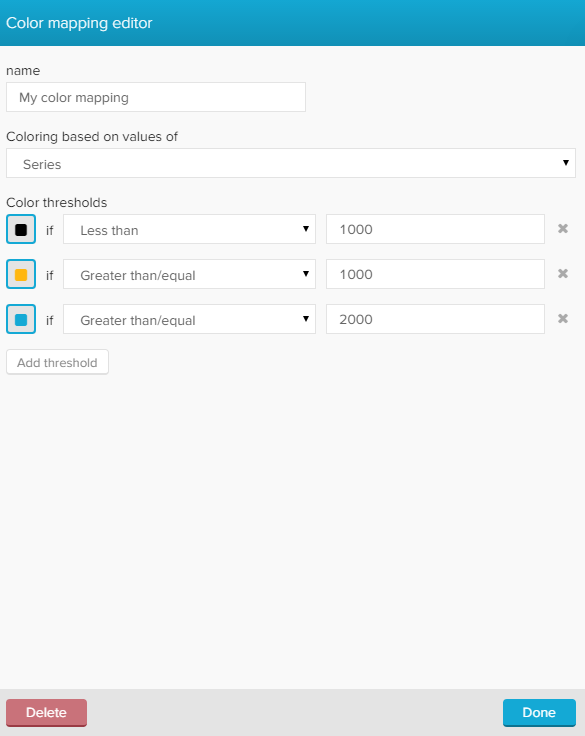
The following color mapping editor will open:
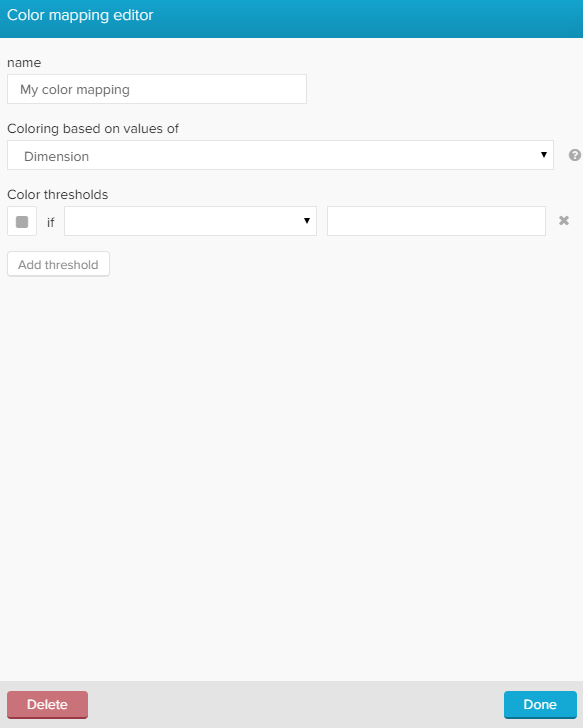
First, let's give our new color mapping a title in the upper text-field.
You can furthermore choose coloring based on values of Dimensions or Series (which is selected by default).
Dimension color rules will be applied on the dimensions, Series color rules will be applied to the KPIs.
We need to define color thresholds.
For each threshold we can specify a comparison function as well as the actual threshold value.
Let's examine the following example:
We want to color all materials which occur at least 2000 times blue, all materials occuring less than 200 times but more than 1000 times yellow, and all other materials (less than 1000) in black.
The following threshold settings need to be made:
Sorting sequence
Celonis 4 prioritizes color threshold settings which have been added recently.
To prevent any coloring overlaps, we strongly recommend to start with the lowest number of cases.