A data series section is set up for every dimension and KPI that has been created in your component (also see general options).
It offers options that are available in the Formula Editor.
The Data Series configurations differ a lot for different components.
For this reason, we strongly recomment to conduct the component's chapter, to know which options are available and relevant for a successful configuration.
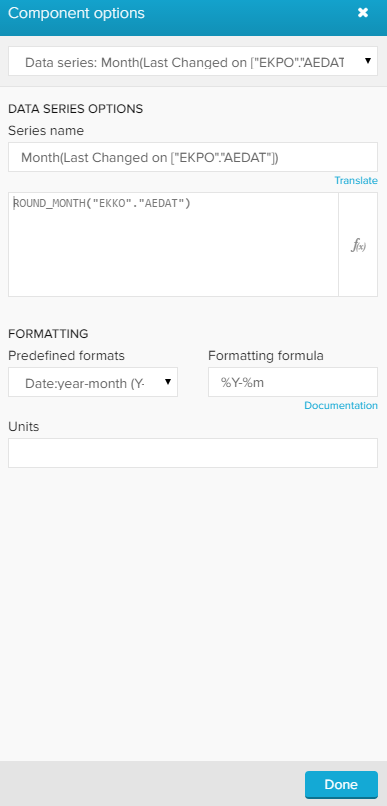
This screenshot shows the Data Series options that are available for all components.
| Expand | ||
|---|---|---|
| ||
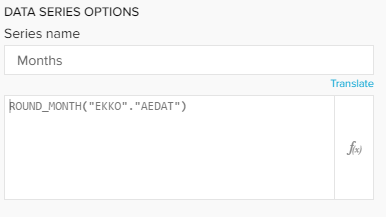
At the top of this section, you may change the Series name. This is the name that is displayed in the dimension section, the KPI section and the sorting section in the general options. Furthermore, you can alter the KPI statement. Click on the small icon ( Please refer to the Dimensions & KPIs chapter for further explanations.
|

| Expand | ||
|---|---|---|
| ||
In this section, you can alter your Value Formatting.
|
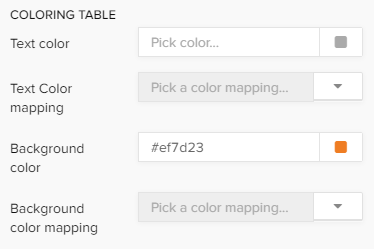
The following option is only available for OLAP Tables:
| Expand | |||||||||||||||
|---|---|---|---|---|---|---|---|---|---|---|---|---|---|---|---|
| |||||||||||||||
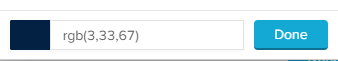
You can color the content of the table, as well as the background.
For both, you can either select a single color or apply a color mapping rule.
|
The following options are only available for charts, that offer linear axis:
| Expand | |||||
|---|---|---|---|---|---|
| |||||
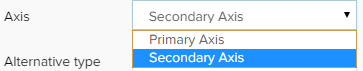
You can display this data series either in your primary value axis or in your secondary value axis with the Axis dropdown menu.
|
| Expand | |||||||||||||||||||||||||
|---|---|---|---|---|---|---|---|---|---|---|---|---|---|---|---|---|---|---|---|---|---|---|---|---|---|
| |||||||||||||||||||||||||
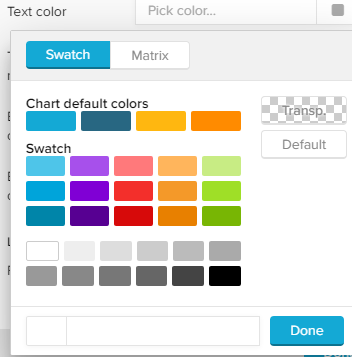
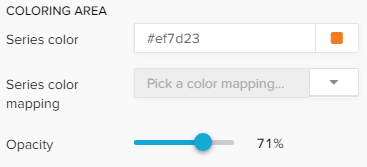
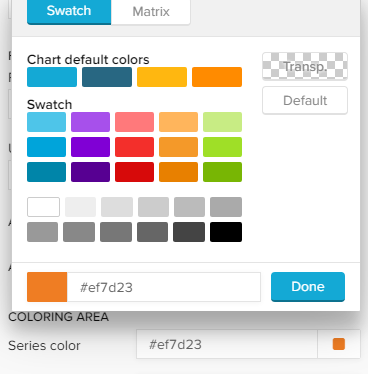
You can color the graph (series color) with the following options: You can choose between a (single) series color, a series palette and a color mapping.
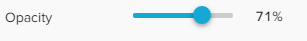
To adjust the opacity of (any) color rule, you can use the opacity slider:
|
| Expand | |||||
|---|---|---|---|---|---|
| |||||
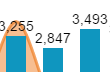
To display the value of the data series above the bars in your graph, you can activate data labels with the checkbox display data labels.
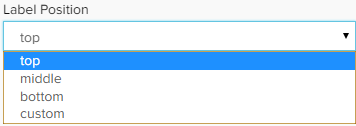
After activating the checkbox, you can adjust the position of the data labels with the dropdown - menu:
Furthermore, you can format the labels with the known formatting options (font, size, alignment, highlight, color).
|
| Expand | ||||||||||||||||||||
|---|---|---|---|---|---|---|---|---|---|---|---|---|---|---|---|---|---|---|---|---|
| ||||||||||||||||||||
You can color your chart (series color) with the following options: You can choose between a (static) series palette and a color mapping.
To adjust the opacity of (any) color rule, you can use the opacity slider:
|
| Expand | |||||||||||||||
|---|---|---|---|---|---|---|---|---|---|---|---|---|---|---|---|
| |||||||||||||||
The following, additional options are available:
|